
MaxLinear (MXL) and the psychology of break-even trades | Radar 87
Volume 87
Breakeven Isn't a Loss. Except When It Feels Like One.
This week was a rough one. Volatility is running hot across the board, and it runs even hotter when your watchlist is packed with names that move three percent before most people finish their morning coffee.
That’s the game we chose to play.
Everyone was talking about rotation this week. Honestly, the data was pointing in that direction, and for most of the week, we were inclined to agree. Then Friday’s close happened, and now we’d rather wait and see what the market actually hands us next week before committing to a view.
The S&P 500 has been on a historic winning streak, and yet the undercurrents are anything but calm. The VIX closed below the 17 level in late May, which looks deceptively placid given how much is simmering beneath the surface. Tech pulled the market higher again this week, which is precisely what makes us cautious.
If rotation is real, tech shouldn’t still be doing the heavy lifting.

There are some names worth watching in the nuclear energy theme.
The thesis isn't complicated: as data centers strain traditional power grids, nuclear companies (particularly those developing small modular reactors) are positioned to provide the kind of 24/7 baseload power that intermittent renewables simply can't. At least one name sits on our watchlist right now. There are others across the spectrum, some more speculative than others.
The week cost us two positions that had been moved to break-even.
Getting stopped at break-even isn’t a disaster, but two in the same week is not exactly what you’d call an encouraging signal. The market was sending a message, and we were listening.
The trade that genuinely got under our skin was a near-perfect setup that went completely sideways. Entry at the break of a key resistance level, not once but twice, we were in positive territory, green on the day, the setup working exactly as drawn.
Then the whole move collapsed and took us out with a loss, the same session!
The next day, the level held, the stock launched, and it never looked back. Are you listening, AppLovin (APP)?

Sometimes the market decides you don’t deserve the position, even when you read it correctly.
It just reminds you that execution and timing are as important as the idea itself. We had the right stock, the right level. Just not the right day.
That’s trading. The market has a remarkable talent for making you feel stupid precisely when your analysis is sound. We followed the plan, respected the stop, and we’re at peace with that.
What stings is not trying the following morning again.

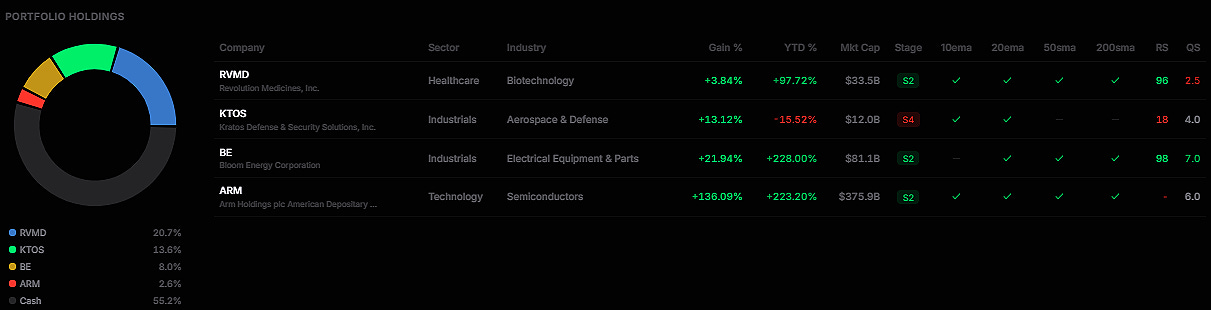
We are still riding the final portion of our Arm Holdings (ARM) position, now sitting at an extraordinary return of 130%. The stock has been up over 200% year to date, with data center royalty revenue more than doubling year over year and committed demand for its AGI CPU already exceeding $2 billion over the next two fiscal years. Shares pushed to an all-time high earlier this month, and the move is starting to look less like a rally and more like conviction hardening into something structural.
We're letting it run.
Here’s a look at this week’s market health, with a breakdown of index and sector performance.



We’re currently building the beta version of our app, and it’s already live.
It is not a generic solution for every market participant, but a platform built specifically for swing trading, momentum strategies, and short to medium-term investing.
You can already sign up, access the beta, and start using it today.
As previously stated, all paid subscribers will receive full access to the platform at no additional cost.
Latest articles:
Each stock carries a risk badge: ⚠️ High | 📊 Medium | 🛡️ Low.
Based on volatility, float, technicals, and fundamentals. Size your positions accordingly.
📈 Free Setup: Make It Count
MXL: MaxLinear Inc ⚠️
What they do: A semiconductor company designing high-speed connectivity chips
Why watch? Twelve months ago, MaxLinear was a broadband recovery story. A decent one, but nothing more. That framing is now outdated, and the market is only beginning to adjust for it.
The Q1 2026 numbers told the story clearly. Revenue grew 43% year over year to $137 million. Infrastructure revenue, which covers the data center connectivity products, grew 136% year over year and crossed over to become the company’s largest revenue category. That is not a gradual mix shift playing out over several quarters. That is a business changing what it fundamentally is, and the numbers confirming it in real time.
To understand why the data center exposure matters as much as it does, it helps to think about what an AI cluster actually requires beyond the GPUs that receive all the attention. Every rack of AI compute needs high-speed optical links to move data between chips across the fabric, copper interconnects for scale-up traffic within the rack itself, fast storage pathways to keep the compute fed, and efficient control-plane connectivity to manage the whole system. MaxLinear designs chips that sit at each of those bottlenecks: 1.6T optical interconnects, copper retimers for scale-up architecture, storage accelerators, and hyperscale PON designs. The company is not adjacent to the AI infrastructure buildout. It is embedded in it.
Management guided Q2 revenue to a midpoint of $165 million and raised the full-year optical data center revenue outlook to $150 to $170 million on the back of stronger customer orders and better forward visibility. The float is not large, which cuts both ways: when this name moves, it moves fast.
Technical Outlook: Since the post-earnings surge, the price has been consolidating inside a tight range, a Darvas box formation where the stock establishes a defined ceiling and floor and compresses between them. We entered once before and were stopped out too early. The setup is developing into something cleaner now. Two or three more sessions of tight price action with the 10-day EMA holding as a floor below the range is the ideal condition before the breakout. The float size amplifies everything, which is exactly why patience on the entry is not optional.



Why We Don’t Wait for Sunday
Markets don’t move on your schedule. The best low-risk entries don’t announce themselves politely and wait for the weekend newsletter.
They show up when they show up. And if you’re not positioned, you miss them.
Paid members get real-time alerts: exact entries, stops, position sizing, and the thesis behind every trade. The same information we use to manage our own capital.
Free members get just one pick on Sunday.
Does that sound like an edge to you?
What’s Inside Premium
Free Access to TradeDeck
Premium members get early access to TradeDeck, the trading platform we’re building. The value of the platform alone already exceeds the cost of the subscription.
Watchlist Elite (5-7 Stocks)
Each selection undergoes rigorous financial analysis, technical evaluation, and strategic assessment.
Full Portfolio Transparency
Every position we hold. Entry price. Current P&L. Stop level. Real money, real risk.
Real-Time Trade Alerts (Chat Access)
This is where the edge lives. Exact entries, stops, and position sizing. Real-time. No lag
Quick Picks (5 Names)
Additional setups that just missed our main criteria but are worth watching.
Chat Access
See our thought process in real time. Ask questions. Watch how we manage risk.
The Tools We Actually Use
Member discounts on TC2000, Fiscal.ai, and other platforms. Same tools, better pricing.
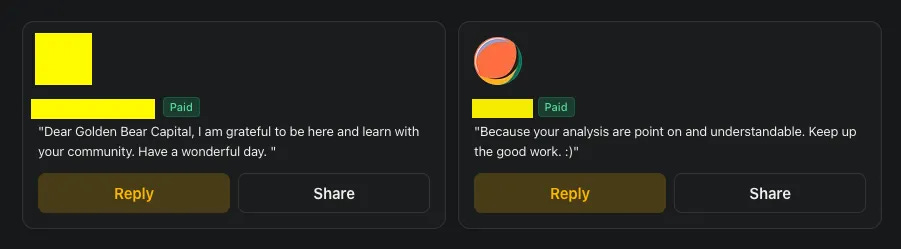
What Paid Members Say:
We’re entrepreneurs first, traders second. We’ve sat in the CEO chair. We know what real execution looks like and how to spot it.
€39/month or 299€/year. Less than one losing trade. Cancel anytime.
Portfolio updates and new positions:

💎📈 Watchlist Elite: Premium Market Movers
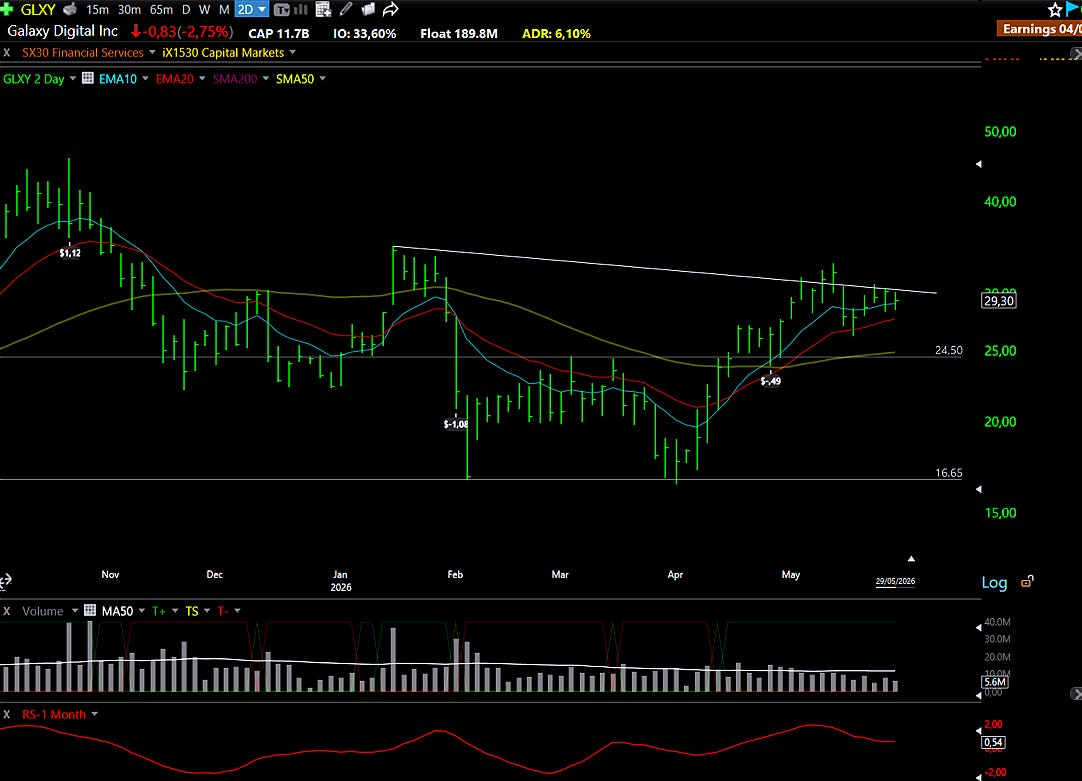
GLXY: Galaxy Digital Inc 📊
What they do: A digital asset financial services company
Why watch? Galaxy Digital is one of the harder analytical exercises in the market right now, and the difficulty is not a reason to avoid it. It is part of what makes the opportunity real.
The centerpiece of the investment case is Helios, a 1.4-gigawatt data center campus in West Texas. Galaxy has leased the first two phases to CoreWeave on a 15-year triple-net lease. Triple-net, for those less familiar with commercial real estate structure, means the tenant covers property taxes, insurance, and maintenance on top of base rent. It is the most landlord-favorable lease structure in existence because the landlord’s costs are almost entirely fixed while the contractual income is locked for the duration. The total estimated contract value across both phases exceeds $16 billion. In Q1 2026, CoreWeave paid on schedule, and Galaxy delivered the first 133 megawatts on budget. Early execution has been clean.
Run the math simply. Apply a 10-12x EBITDA multiple to the Helios segment alone, which is conservative for a long-duration, triple-net contracted infrastructure asset, and you arrive at a valuation that covers most of Galaxy’s current enterprise value. That means the digital asset business, the trading operations, the stablecoin exposure, and everything else the company does come essentially for free at current prices. That is the argument, and it is not a weak one.
The complication is that the market cannot quite decide what Galaxy is. It trades like a crypto company when sentiment in that space weakens, even though the majority of its economic value is now in a contracted infrastructure asset that has nothing to do with token prices. That classification mismatch creates volatility. It also creates the window.
Technical Outlook: After an 80% run in roughly six weeks, the stock is consolidating, which is the right behavior after a move of that size. On the daily chart, price is sitting beneath a descending trendline with the 10-day EMA providing support from below. The 20-day EMA has already been tested once and held. The $30 level is the real line in the sand. A few more sessions of tight price action on the right side of this pattern would be the ideal condition, though a brief undercut of the 20-day EMA that gets recovered quickly would work equally well as a setup. Either way, we are not in a rush.
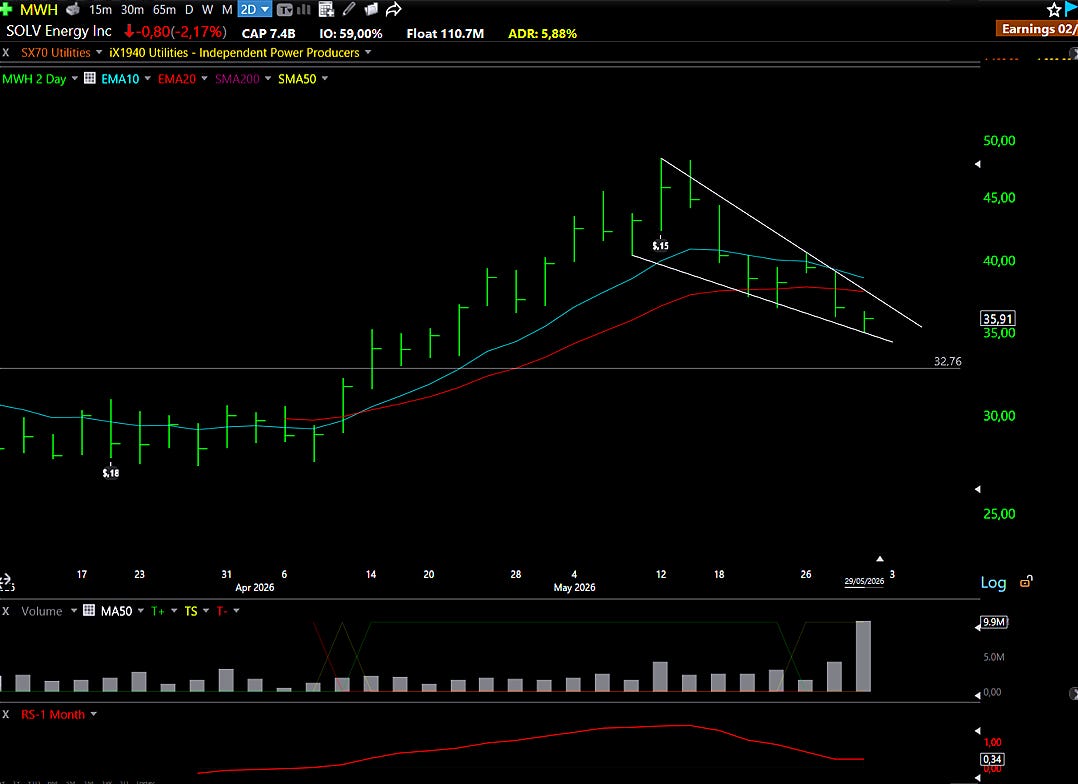
MWH: SOLV Energy Inc 📊
What they do: A solar engineering and construction company
Why watch? The easiest mistake an investor can make with SOLV Energy is reading “solar EPC” and moving on. That two-word description is technically accurate and almost entirely useless for understanding what the business actually is.
Most construction companies in this space operate on a simple model: build the plant, collect the fee, find the next project. Revenue is lumpy, margins are thin, and the business is essentially a function of how many projects you can win in a given cycle. SOLV does not work that way. The company retains operations and maintenance contracts across the 35-year life of every plant it builds, which means each completed project becomes a recurring revenue asset rather than a closed chapter. More than 500 plants have been built, with over 21 gigawatts of total installed capacity and 20 gigawatts currently under active management across 150 operating facilities. That is not just an EPC business. That is an installed base with a compounding revenue stream attached to it.
The unit economics behind the model are worth spelling out. Management has described illustrative figures in which an average build cost of $0.80 per watt translates into a lifecycle revenue opportunity of $1.20 per watt. That is roughly 45% more revenue generated over the life of the asset compared to the upfront construction fee alone. Once a utility or developer trusts a company to keep a large power plant running efficiently for three decades, that relationship becomes very difficult to replace. The switching cost is not contractual. It is operational. Nobody wants to change the team managing a critical energy asset mid-lifecycle.
The current backlog sits at $8 billion. What matters as much as the size is the quality: the entire backlog consists of Safe Harbor projects. Safe Harbor, in solar development, refers to projects that have already secured the equipment and tax credit commitments that protect them from near-term policy changes. In a policy environment that has been anything but stable, that distinction is significant.
Q1 revenue came in at $676 million, beating estimates by nearly 9% and growing 66% year over year. Then, right as the week was closing, the company priced a $540 million secondary offering at $36 per share, split between new primary shares and selling shareholders.
Technical Outlook: The offering price at $36 is the anchor. That is where institutional capital has just been committed, which makes it a functional reference point for the trade. Anything below that level, with a clean setup developing, becomes interesting on a risk-reward basis. The stock is currently forming a falling wedge, which is a constructive pattern, though the slope is steep enough that a breakout may require a retest of the level before following through rather than launching vertically. The stock is trading below the 10 and 20-day EMAs, which is not the typical entry we look for. But this is a recent IPO with limited public coverage, a business model the market has not fully priced, and a clear line in the sand from the offering itself. The overhang may generate some early-week softness. That softness could be the setup.
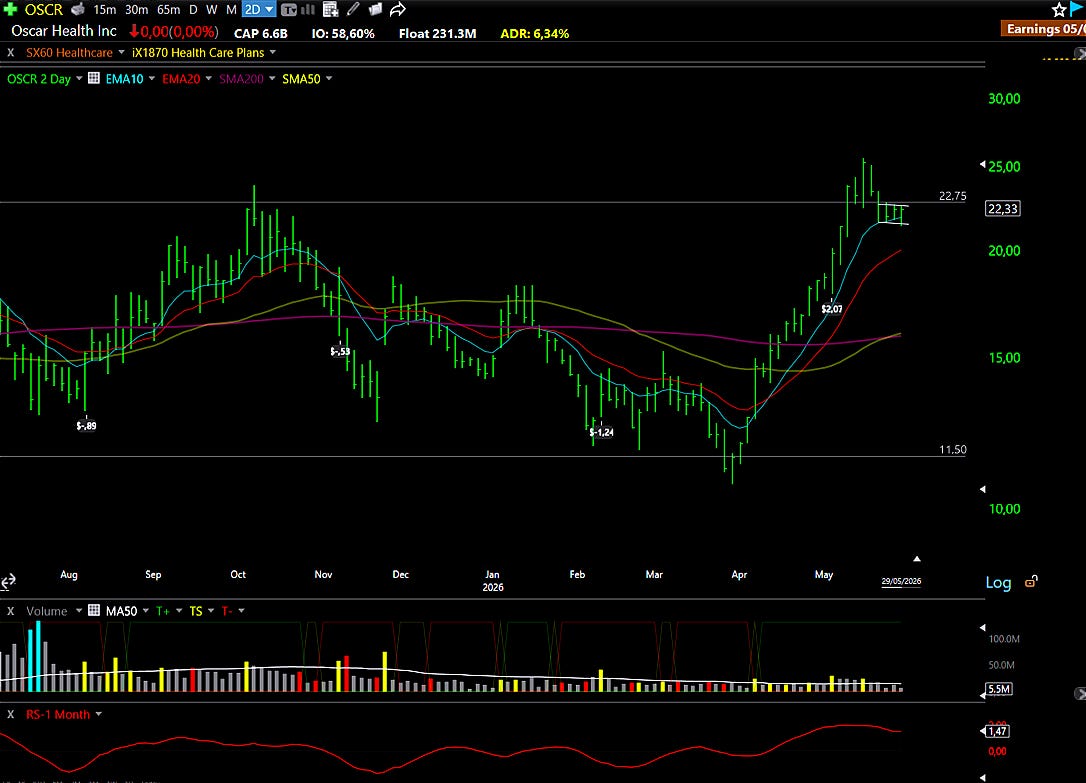
OSCR: Oscar Health Inc 📊
What they do: A technology-driven health insurance company
Why watch? Health insurance rarely generates excitement. Oscar is quietly building a case that demands attention regardless.
The Q1 2026 numbers were difficult to dismiss. Revenue came in at $4.65 billion, up 52.7% year over year. The medical loss ratio was 70.5%. For those less familiar with insurance economics, the MLR is the most important single number in the business: it measures what percentage of premium revenue gets paid out as claims. A lower number means the company is better at pricing risk, managing utilization, and keeping members healthier. UnitedHealth Group, one of the most operationally mature insurers in the world with decades of actuarial data, reported an MLR of 83.9% in the same quarter. Oscar’s 70.5% is not just competitive. It is exceptional. Net income came in at $679 million, and management reaffirmed full-year operating earnings guidance of $250 to $450 million without narrowing or softening the range. That kind of full reaffirmation after a strong first quarter signals that management sees the second half clearly enough to hold the number.
The structural advantage is real. Oscar built its technology platform from scratch rather than inheriting the legacy systems that most traditional insurers are still running. That gives it genuine advantages in claims automation, member engagement, and risk selection that compound over time and are difficult for incumbents to replicate without dismantling infrastructure that has been in place for decades.
Technical Outlook: The chart has been building something significant for a long time. Since 2024, Oscar has been contained inside a very large range-bound structure, a multi-year Darvas box that has repeatedly stopped the stock at the same ceiling and caught it at the same floor. Patterns of this duration and size matter because the eventual resolution tends to be proportional to the time spent building the base. Price is currently sitting just beneath the upper boundary of that structure, supported by the 10-day EMA, and the same pattern reads clearly on both the daily and monthly charts. That kind of multi-timeframe alignment is not common. This is also the first consolidation after a substantial move off the bottom of the channel, which gives it the structure of continuation. Patient, but potentially powerful.
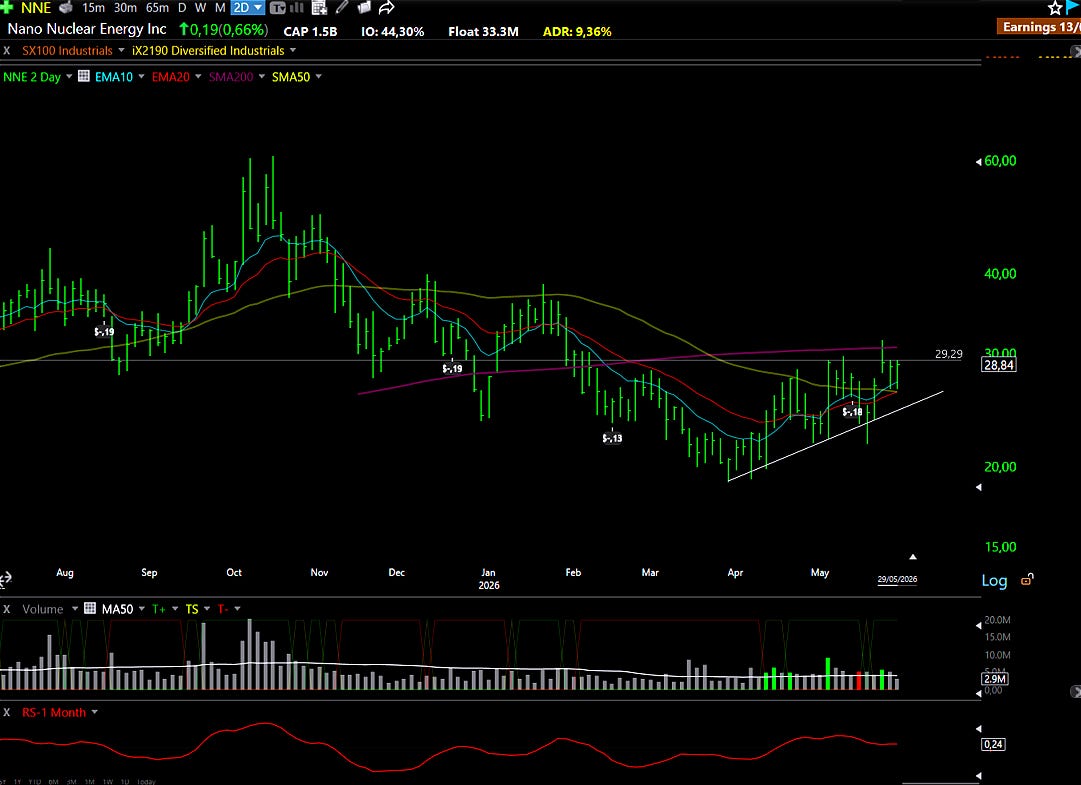
NNE: Nano Nuclear Energy Inc ⚠️
What they do: An early-stage company developing microreactors
Why watch? The energy math is not subtle. AI data centers are consuming electricity at a pace the existing grid was not built to handle, and the obvious alternatives fall short in important ways. Solar and wind are intermittent, meaning they generate power only when the sun is out or the wind is blowing. Nuclear provides what the industry calls baseload power: continuous, weather-independent generation that does not require storage or backup to be reliable. The political and regulatory momentum behind advanced nuclear has been building for years, and the question for investors is no longer whether it scales, but who benefits when it does.
Nano Nuclear is developing microreactors, which are a smaller variant of the small modular reactor concept that has received most of the institutional attention in this space. Where a traditional nuclear plant generates hundreds or thousands of megawatts and requires a decade to permit and build, a microreactor can be deployed on-site, often containerized or placed underground, and can run in isolation or alongside other units to build up capacity incrementally. The company is developing both terrestrial and lunar variants.
What separates Nano Nuclear from most names in the sector is its approach to vertical integration. The company operates subsidiaries across nuclear fuel enrichment, transportation, and storage, intending to own every part of the supply chain except the mining operations. HALEU, which stands for high-assay low-enriched uranium, is the specific fuel grade required by advanced reactors, and it is genuinely scarce infrastructure. The recently acquired Secured Transportation Services subsidiary has already completed three real-world nuclear materials transport missions: a record-setting international HALEU shipment from Japan, uranium removal support in Venezuela, and a domestic HALEU delivery for advanced reactor fuel testing. These are completed, DOE-aligned operations, not roadmap items.
Owning the logistics and fuel infrastructure before the reactors reach commercial scale is a meaningful strategic position. If this sector develops the way demand suggests it should, control of the supply chain becomes a genuine bottleneck. That said, the reactor technology is unproven at commercial scale, the regulatory pathway is long and unforgiving, and profitability is years away. Position sizing should reflect that reality clearly.
Technical Outlook: The broader nuclear sector looks like it is in an accumulation phase, with multiple names consolidating simultaneously after earlier runs. The $29 to $29.50 range is the key level on NNE specifically, and a clean break above it on meaningful volume is what the setup requires. For investors who want exposure to the same theme at substantially lower risk, Talen Energy (TLN) is a profitable, revenue-generating nuclear business with a very different risk profile. We want to see more consolidation before committing, and we want the rest of the group to be moving in the same direction before treating any individual setup here as fully actionable.
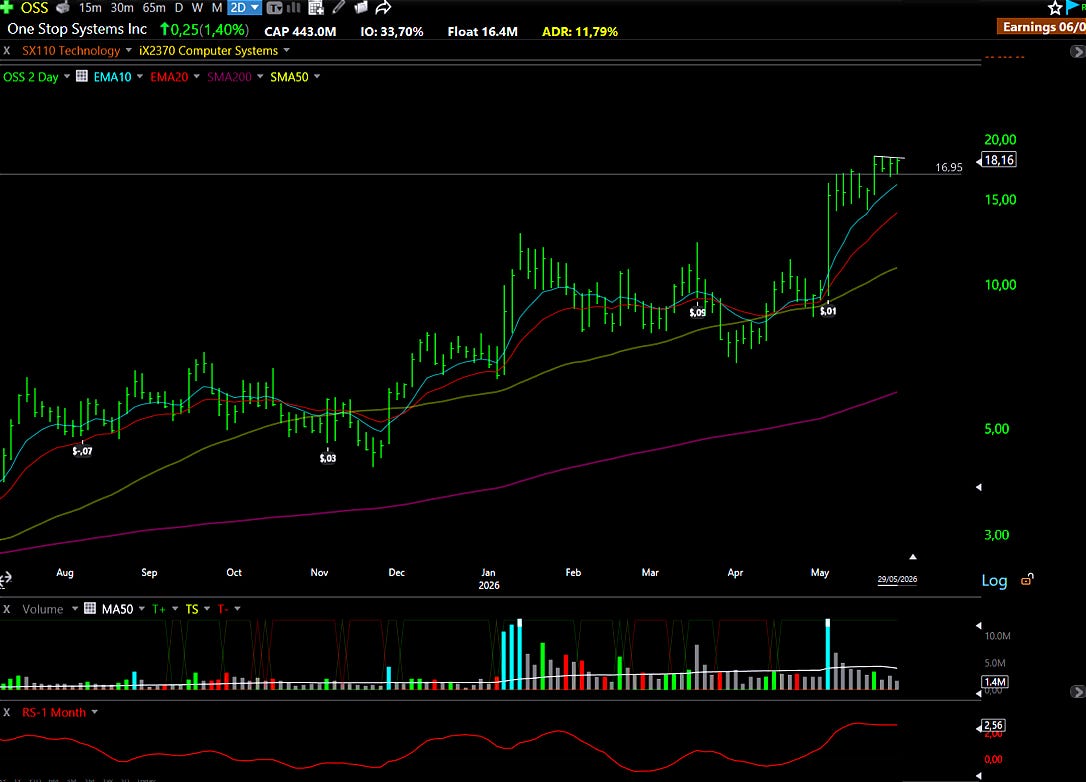
OSS: One Stop Systems Inc ⚠️
What they do: A defense hardware manufacturer
Why watch? The defense technology conversation is dominated by software. Autonomous systems, battlefield AI, cyber capabilities. Much less attention goes to the hardware layer that makes any of it functional outside a controlled environment. One Stop Systems has quietly built a defensible position in exactly that gap.
The core product is ruggedized compute: data center-class AI processing hardware engineered to survive the physical conditions that destroy conventional servers. Temperature extremes, constant vibration, electromagnetic interference, unstable power supplies. Standard commercial hardware fails in those environments. OSS designs and manufactures systems that bring GPU-level performance into armored vehicles, maritime patrol aircraft, submarines, and autonomous drones.
The business model creates natural durability. OSS holds a sole-source supplier position for military-grade NVMe flash storage on the Navy’s P-8A maritime patrol aircraft. Sole-source means the government has determined that no other vendor can supply a functionally equivalent product, removing competitive tendering from the equation entirely. The contract runs five years at $36 million; lifetime contracted revenue on the program now exceeds $65 million, and more than $23 million has been awarded since early 2025 alone. Demand is accelerating, not plateauing.
Q1 2026 confirmed an inflection. Revenue grew 54.9% year over year to $8 million, beating estimates by $1.1 million, driven by the P-8A deliveries, medical imaging compute sales, and prototype systems for a combat vehicle enhanced vision program. Gross margins crossed 50%. Management guided for 20% to 25% full-year revenue growth alongside positive EBITDA.
The company is small, the float is tight, and institutional coverage is thin. That combination means it gets missed. It also means that when the story becomes more widely understood, the re-rating can be disproportionate to what the size of the business would normally suggest.
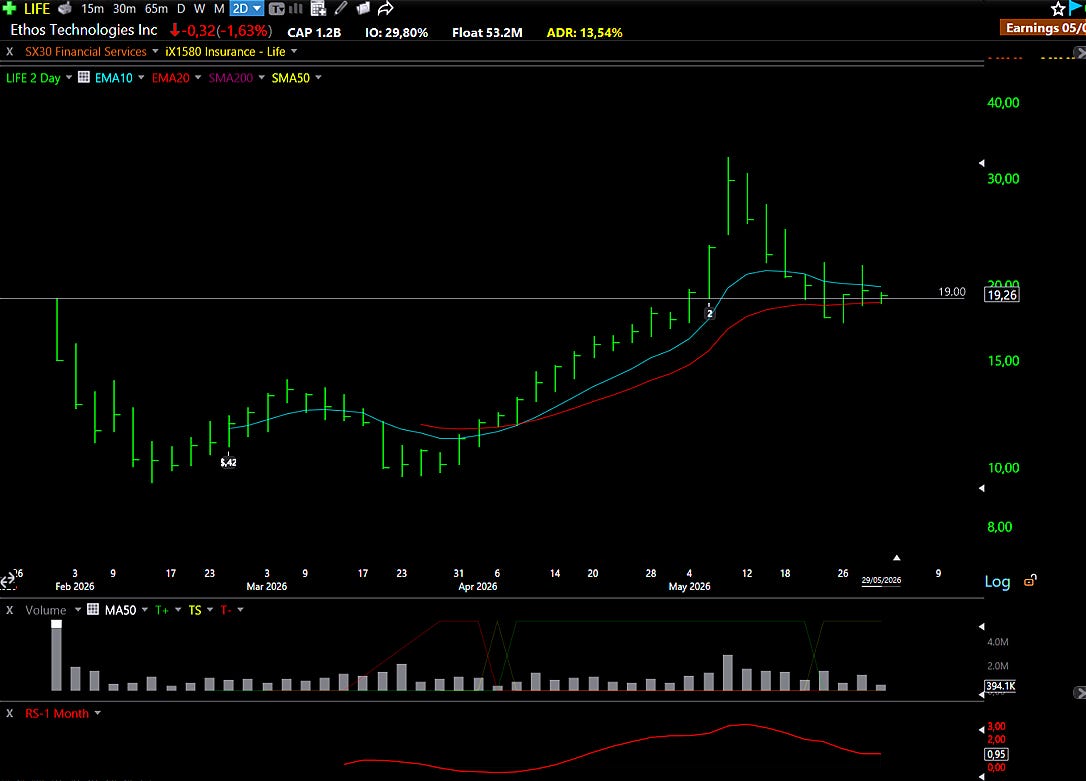
LIFE: Ethos Technologies Inc ⚠️
What they do: A digital life insurance platform
Why watch? Life insurance is one of the last financial products still running largely on manual processes, paper applications, and in-person sales relationships that take years to build. Ethos was built on the premise that the entire process could be automated without sacrificing the underwriting quality that makes a policy worth anything. The revenue trajectory is making a strong case that the premise is correct.
The platform processes 95% of applications automatically, meaning no human underwriter reviews the file, no medical exam is required, and a policy can be issued in minutes rather than weeks. That speed matters primarily because the traditional alternative is slow enough that a significant portion of applicants abandon the process before completing it. Ethos captures that demand by removing the friction that traditional distribution was quietly losing through attrition.
The product mix shift that started at the beginning of 2026 deserves attention. The company moved away from term life insurance, which is simple, low-premium, and generates modest commissions, toward whole life, indexed universal life, and final expense policies. These products carry higher premiums and generate meaningfully better economics for both the platform and the carriers. That transition is showing up cleanly in the revenue line: $88.8 million in Q2 2025, $93.8 million in Q3, $110.1 million in Q4, and $193.1 million in Q1 2026. Revenue more than doubled in three quarters. The Q1 year-over-year growth rate was 104%. Gross margins ran between 94% and 98%, reflecting the asset-light commission model where Ethos earns fees without bearing insurance risk. Management reported a Rule of 40 score of 121, which is an exceptional reading by any standard. For context, the Rule of 40 is a metric used in platform and software businesses that combines revenue growth rate with profit margin. A score above 40 is considered strong. 121 is not a number you see often.
The legitimate concern is that Q1 also showed operating and net losses that expanded alongside the revenue surge. Scaling fast is expensive, and Q1 is seasonally the strongest quarter, which means the second and third quarters will test whether the underlying economics hold outside the peak period. Those are real questions without resolved answers yet.
The stock priced its IPO at $19, ran sharply higher, and has since retraced back to that same level. IPO prices tend to act as psychological and technical floors because they represent where the earliest institutional investors and employees received their shares. Whether that floor holds here is the question the next few sessions will answer.
Technical Outlook: Price is currently compressed between the 10 and 20-day EMAs, which signals a decision point approaching. Volume picked up notably on Friday, which could mean sellers are being absorbed at the $19 level, or it could mean distribution. The $19 reference is the only line that truly matters right now. If the stock stabilizes there and the volume pattern clarifies, the setup into next week becomes actionable. If it fails that level, the chart changes character entirely. We are watching, not committed.
These tickers below didn’t make the main cut, but they’re on our radar for a reason. We’ve vetted them; now you decide if they fit your game.
More opportunities, less noise.
⚡📋Scanned Stocks: Quick Picks
AMPG - AmpliTech Group Inc
DGXX - Digi Power X Inc
HIMX - Himax Technologies Inc
DOCN - DigitalOcean Holdings Inc
STUB - StubHub Holdings Inc
"If there are more fools in the market than paper, the stock market goes up. If there is more paper than fools, it goes down."
André Kostolany
Disclaimer: This analysis is for informational purposes only and should not be considered financial advice. Always conduct your research and consult with a licensed financial advisor before making investment decisions.
Questo pezzo era gratuito. Il prossimo arriva domenica.This piece was free. The next one lands on Sunday.
Dieci nomi con i livelli, la lettura del mercato, la chat con le posizioni in diretta. Con l'abbonamento leggi tutto; senza, ricevi la parte gratuita via email.Ten names with their levels, the market read, the chat with live positions. Subscribers read everything; free readers get the free part by email.