
Why a rising index can hide a weak stock market
The index is green and your watchlist is mostly red. Neither observation has to be wrong. The index and your list answer different questions about the same session.
An index return depends on its construction and the weights of its constituents. Market breadth measures how widely a move is shared across a defined group of stocks. Comparing the two helps explain the session without predicting the next one.
A ten-stock index on paper
Imagine an index of ten companies. The two largest weigh 40% each. The other eight weigh 2.5% each. For this one-period example, keep those weights fixed and ignore dividends and rebalancing.
The two big companies rise 2% each and contribute +1.6 percentage points together. The eight small ones fall 1% each, contributing −0.2 points in total. The weighted index rises 1.4%, while eight of its ten constituents fall.
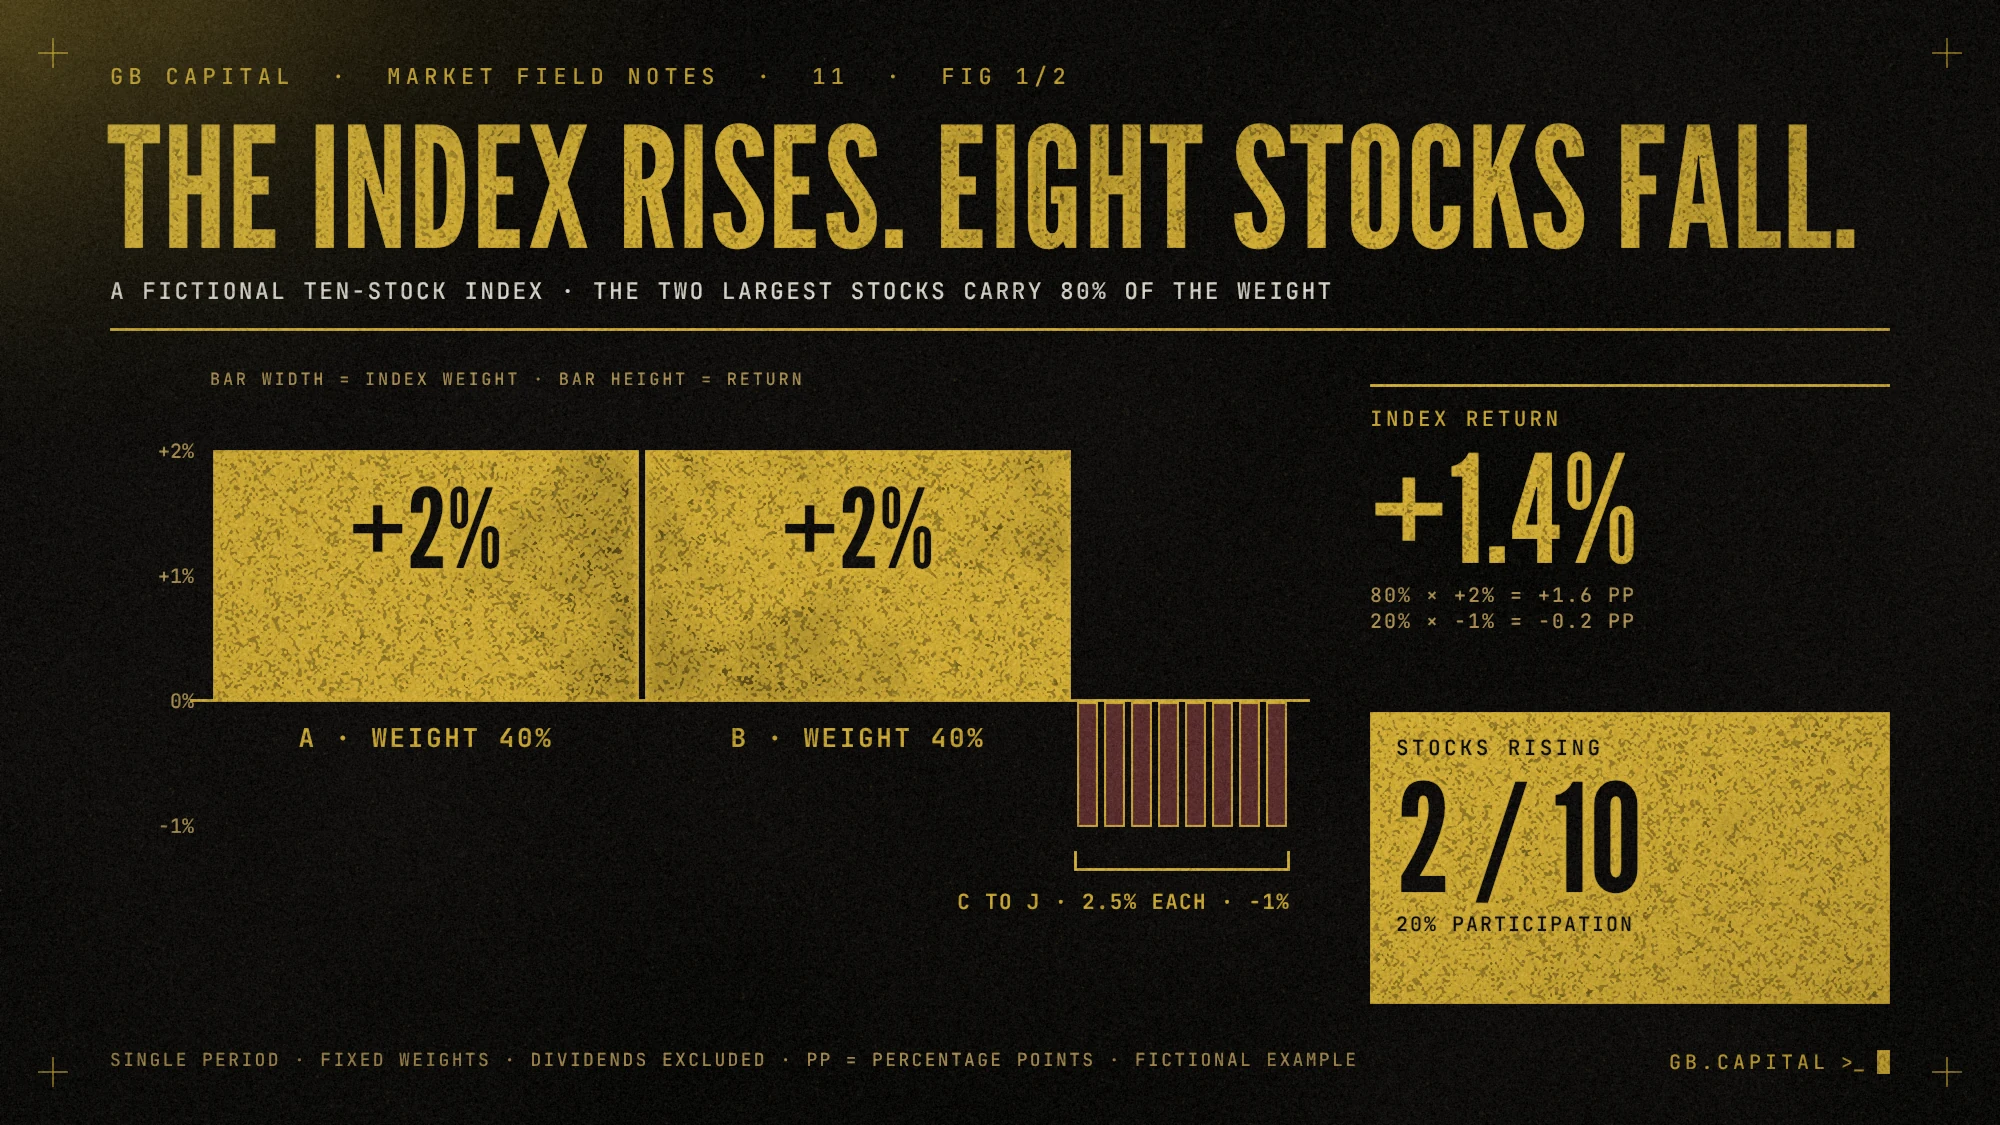
Only 20% of the stocks rose, but their weight was enough to lift the index. Someone following the other eight stocks could therefore experience a very different session from the one suggested by the headline return.
Specify the breadth measure you are using
'Breadth is weak' needs a definition. A simple daily count separates advancing from declining stocks. An advance-decline line adds up the difference over time. Another measure counts the share of a specified universe trading above a stated moving average.
These use different inputs and time horizons. A stock can fall today and still trade above a longer moving average, and a universe can show more daily advancers while its longer-term participation stays narrow. Label the measure, universe, timeframe and date before you compare two readings.
Compare breadth and index return on the same universe
Do not compare the breadth of one exchange or list with the return of an unrelated index as though they described the same group. Differences in size, sectors and inclusion rules explain part of any divergence.
Check historical comparisons too. A chart recalculated using today's constituents may omit companies that were included at the time. Establish how the data was constructed before treating it as a record of information available then.
Use the context to review stocks you follow
If index gains are concentrated, ask whether the companies on your active list take part in the move, and why. A stock-specific event may matter more to one name than the direction of the broad index. Several holdings that look different may also share exposure to the same leading theme.
Breadth adds context, but a trade plan still needs a reason to enter, a catalyst and an exit criterion. A single reading or proprietary score is not enough to decide a trade.
Make the review repeatable
Write down the index you looked at, the breadth measure, the universe and the date, plus what the combination suggests you should investigate in your own list. At the next review, compare like with like before you decide conditions changed.
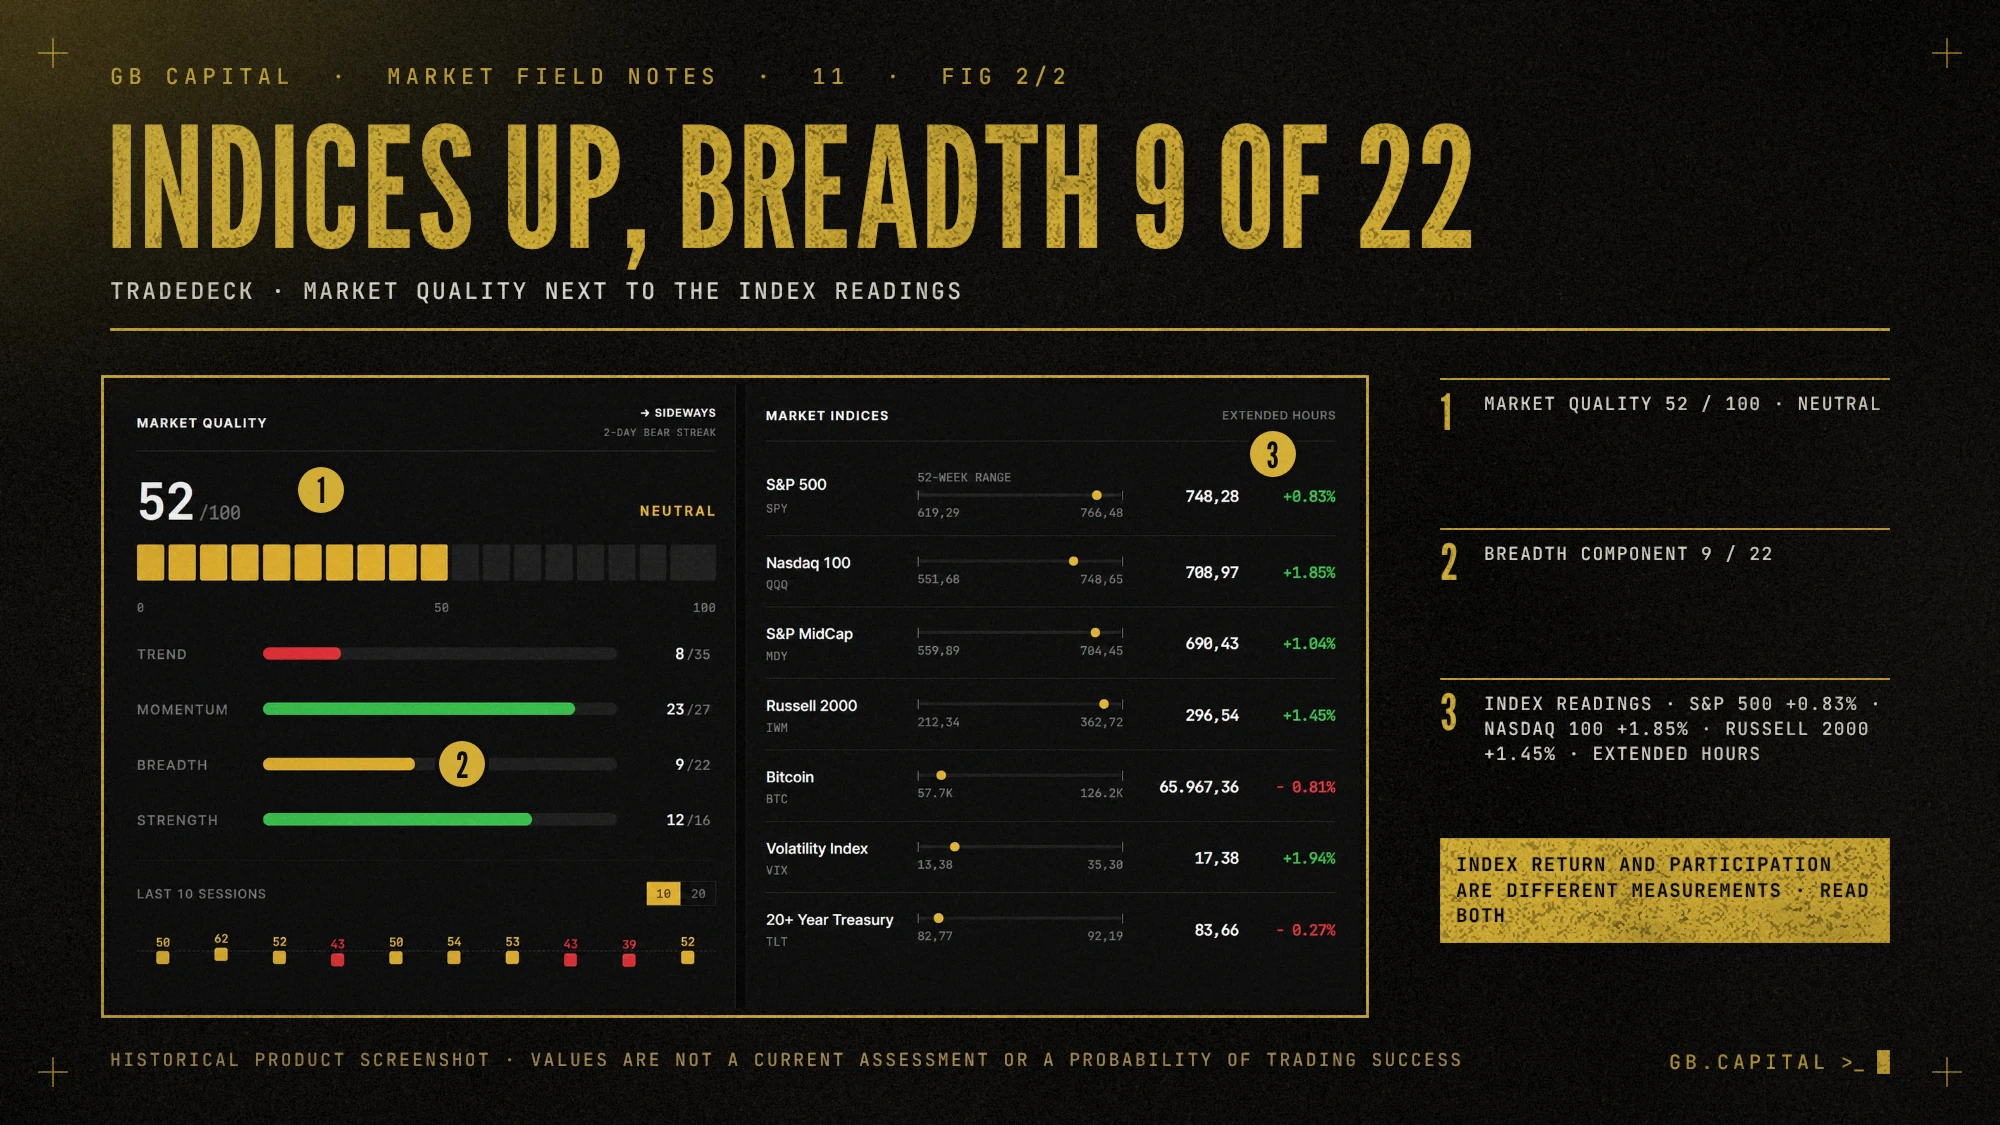
TradeDeck brings together market context, sector rotation, thematic baskets and company information. The screenshot below shows the interface at an earlier date; its score is not an estimate of the probability of profit. TC2000 users can also see our workspace setup with Market Monitor. To start without either product, calculate the ten-stock example's weighted return and count how many stocks rose.
Educational material, not investment advice or a recommendation. The index in the example is fictional.