
Swing trading stocks: a practical process

Monday morning. Ten stocks on the watchlist, three earnings reports on the calendar, and a chart that looks ready to break out. Buying it is easy. Deciding whether the account should take another position takes more work.
That is where our swing trading process begins. We read the market, compare candidates and write the conditions of the trade before placing an order. The chart still matters. It sits inside a decision that also includes the business, the next event and the positions we already own.
This introduction draws on The Operator’s Playbook, our English swing trading course. The three illustrated pages below are selected extracts from the book. We explain the sequence here; the course develops the setup families, execution rules, exercises and complete trade examples.
What is swing trading in stocks?
A swing trade aims to participate in a price move over days or weeks. Some positions last longer when the trend continues. You carry the stock through market closes, which means news can change its price before the next regular session. Your intended holding period belongs in the plan alongside the entry and exit.
We look for a price structure we can define and a business reason for the market to reprice the company. An earnings release, a change in guidance or a contract can supply that reason. We still need an entry where the potential loss makes sense. A persuasive company story can coexist with a poor trade.
If you are choosing a time horizon, start with our comparison of swing trading, day trading and investing. If the mechanics are new, the ten checks before your first swing trade cover orders, costs and overnight exposure.
Start with the market before selecting a stock
Suppose several stocks break above resistance and fall straight back into their ranges. Changing an entry indicator might help an individual trade. First we check whether the failures are happening across the watchlist.
We compare the direction of the broad market, volatility and participation. SPY, QQQ and IWM offer different views of US equities: large companies, the Nasdaq-100 and smaller companies. When their behaviour diverges, we investigate which groups are carrying the advance and which are being left behind.
Market breadth counts participation beneath the headline index. Measures include advancing versus declining stocks and the percentage trading above a moving average. A rising index with fewer participating stocks calls for a different discussion of risk from a broad advance.
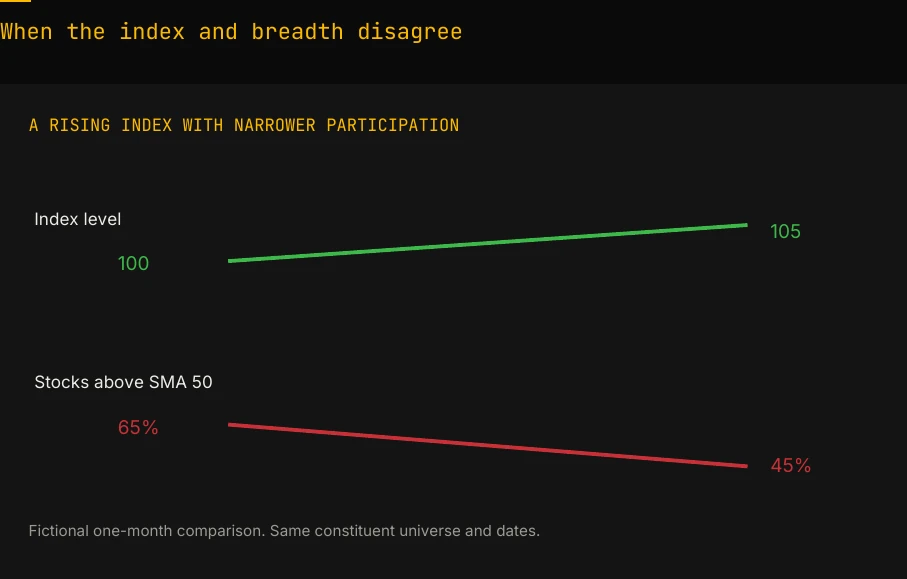
The example above uses the same constituent universe and dates. Without that consistency, the comparison can mislead. Breadth provides context for a new commitment; it cannot tell you the next closing price.
Turn stock screening into a manageable watchlist
A scanner can return hundreds of attractive charts. Each result still needs someone to check the spread, liquidity, price structure, company news and upcoming events. The list becomes useful when it fits the time you have to review it.
Our course separates a research list from an active list. A company can deserve further study while remaining far from a useful entry. On the active list, we want a condition that could require a decision soon. Writing that condition prevents an interesting ticker from becoming an impulsive purchase.
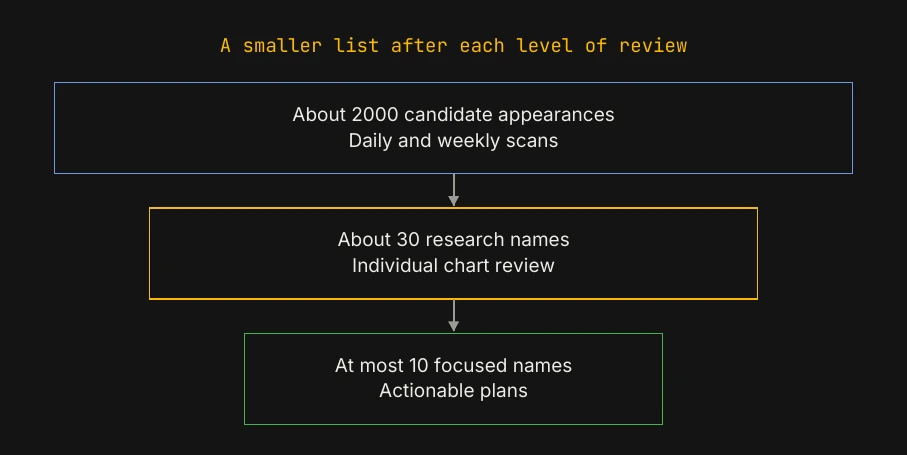
Repeated names from one industry can tell us where attention is concentrating. They also raise a portfolio question: would several positions depend on the same event? Ten different tickers may carry much the same risk.
Our stock watchlist guide explains how to set the list’s size and review schedule. The TC2000 setup packages the workspace we use; the reasoning can also be recorded with another charting platform and a spreadsheet.
Check the catalyst behind the price move
For each candidate, we ask what happened, what it could change in the business and how the market is reacting. These questions lead to different evidence. The announcement establishes the event. Revenue, margins, timing and conditions help establish its possible economic effect. Price and volume show the trading response.
A contract worth $20 million has a different scale for a company with $50 million in annual revenue than for one with $5 billion. Its duration matters too. We read the underlying announcement before treating a headline as a reason to trade. The guide to researching a company through primary sources gives a starting route through filings and investor relations.
Write the trade plan before the order
For a candidate approaching an entry, write the trigger, the point where the idea is wrong, the number of shares and the next scheduled event. Record the sector or theme and any existing position with similar exposure. If an earnings date is unknown, write “unknown” and verify it. A blank field is too easy to read as an empty calendar.
Position size connects the entry and planned exit to a money amount. In a hypothetical example, buying at $50 with an initial stop at $48 creates $2 of planned risk per share. A $100 risk budget corresponds to 50 shares before costs. Those shares commit $2,500 to the position.
If the stock opens at $45 and the exit fills there, the loss is $250 before costs. The $100 budget was a calculation at the planned stop price. Execution can produce a larger loss. Our guides to position sizing and earnings gaps and overnight risk work through those differences.
Manage the position and preserve the evidence
After entry, the original plan gives you something to compare with events. Did the stock hold the level? Did the next announcement change the thesis? Has exposure to one theme grown as several positions moved together? Partial sales, additions and exits each change the account and need a recorded reason.
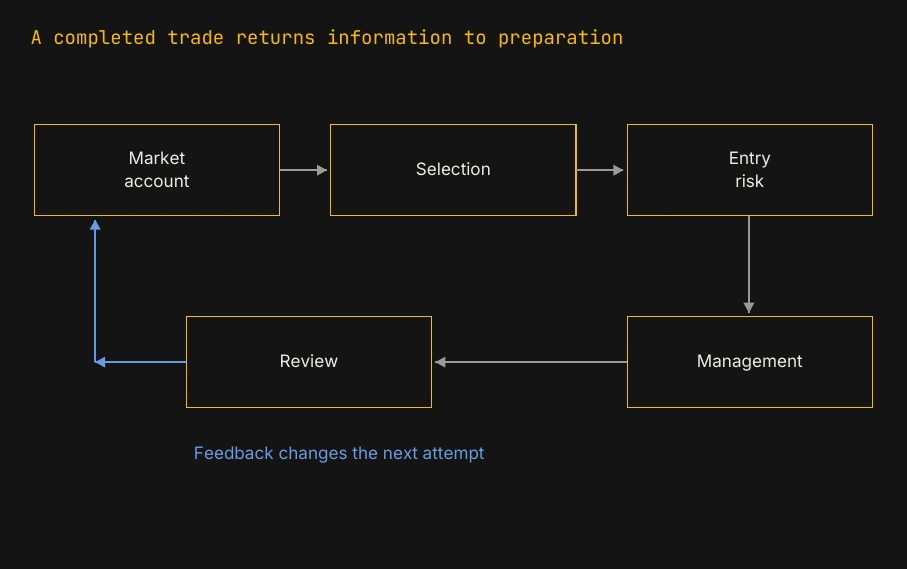
Save the chart before the trade as well as after it. The first captures the evidence available when you made the decision. The second lets you compare that decision with the outcome. A profitable trade can contain an execution mistake; a planned loss can follow a sound decision. Our trading journal guide helps keep those cases separate.
Study the complete process in The Operator’s Playbook
The English course follows this sequence across 192 PDF pages, with six setup families, annotated charts, exercises, operating cards and a complete trade workshop. We chose a written format so you can keep the guide beside your charts, return to a chapter and compare the explanation with the market in front of you.
The course costs €295 and includes one 50-minute educational call. Book within 90 days of purchase by emailing your order reference and three suitable times. Bring your work and questions so the discussion starts from the part you want to understand better. The PDF is delivered by email after confirmed payment. The Italian edition is still being translated.
See the course preview, included materials and purchase details →
If you want to practise first, take one candidate and write five lines: market context, reason to watch, entry condition, planned loss and next event. Leave an unresolved question visible and find its source before placing an order.