
Honeywell Aerospace (HONA): stock research in a choppy market
Volume 97
The White Room
Take a ping pong ball, cut it in half, tape the two halves over somebody’s eyes. Red lamp in front, white noise in the headphones. Nothing else. No shapes, no edges, just an even field of pink light.
For the first half minute they’ll tell you they see nothing. Then it starts. A face. A horse walking. A bit of coastline, somebody they knew years ago. They’re not making it up and there’s nothing wrong with them. Their visual system has been handed an absence, it won’t accept the absence, so it builds something out of its own static.
Psychologists have been running this since the 1930s. They call it the Ganzfeld. The finding never changes: a brain built to find signal will manufacture signal when there isn’t any.
Now sit a trader in front of a market that hasn’t trended in three months.
That’s the real risk this week, bigger than any position we’re carrying.
Every sideways range starts to look like a base. Two green days and something in your chest says this is the turn. Trades that didn’t work get quietly rewritten in your memory as trades that almost worked. Nobody decides to do this. It happens the way the horses happen.
We got a small demonstration.
First week back after three weeks off, two entries, two losses. Both small enough to be irritating rather than expensive, but two out of two is two out of two. The confidence comes back from holiday several days before the reflexes do, and that’s a rotten order for those two to arrive in.
Then Figma. We got out, and the next session it went up ten percent without us. We spent that afternoon being very quiet. The day after, it handed back more than half the move.
So the thing we were mourning had a shelf life of about eighteen hours.
That’s the whole market in one ticker. You can be right about a name and still not get paid for it.
Which is why we’d rather measure the tape than look at it.
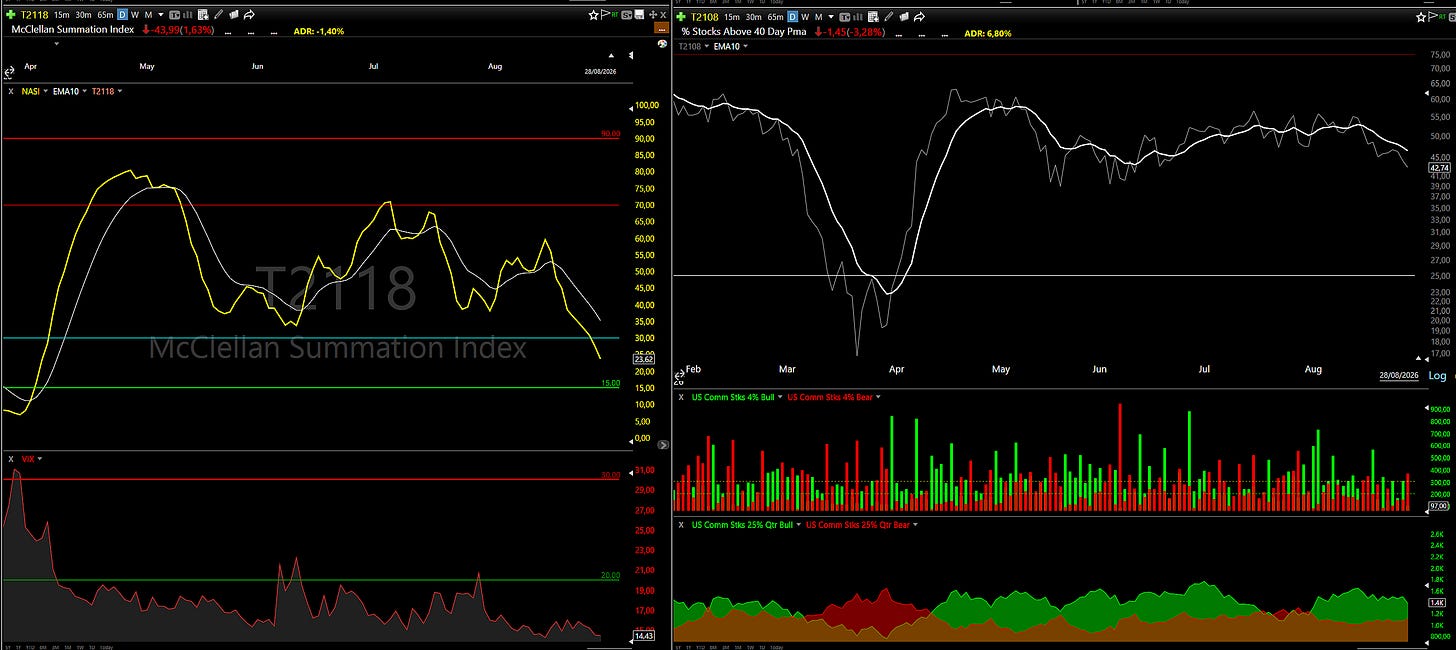
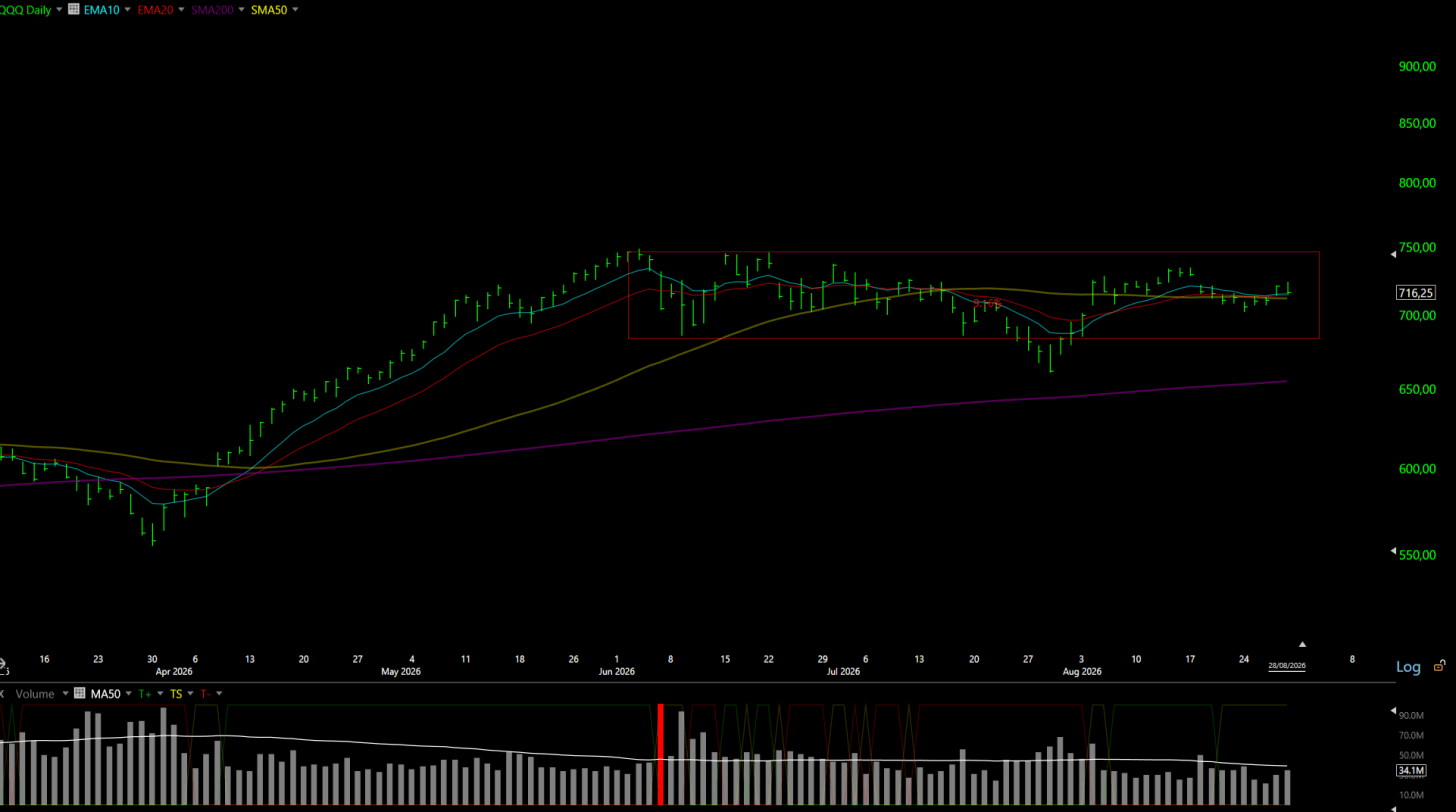
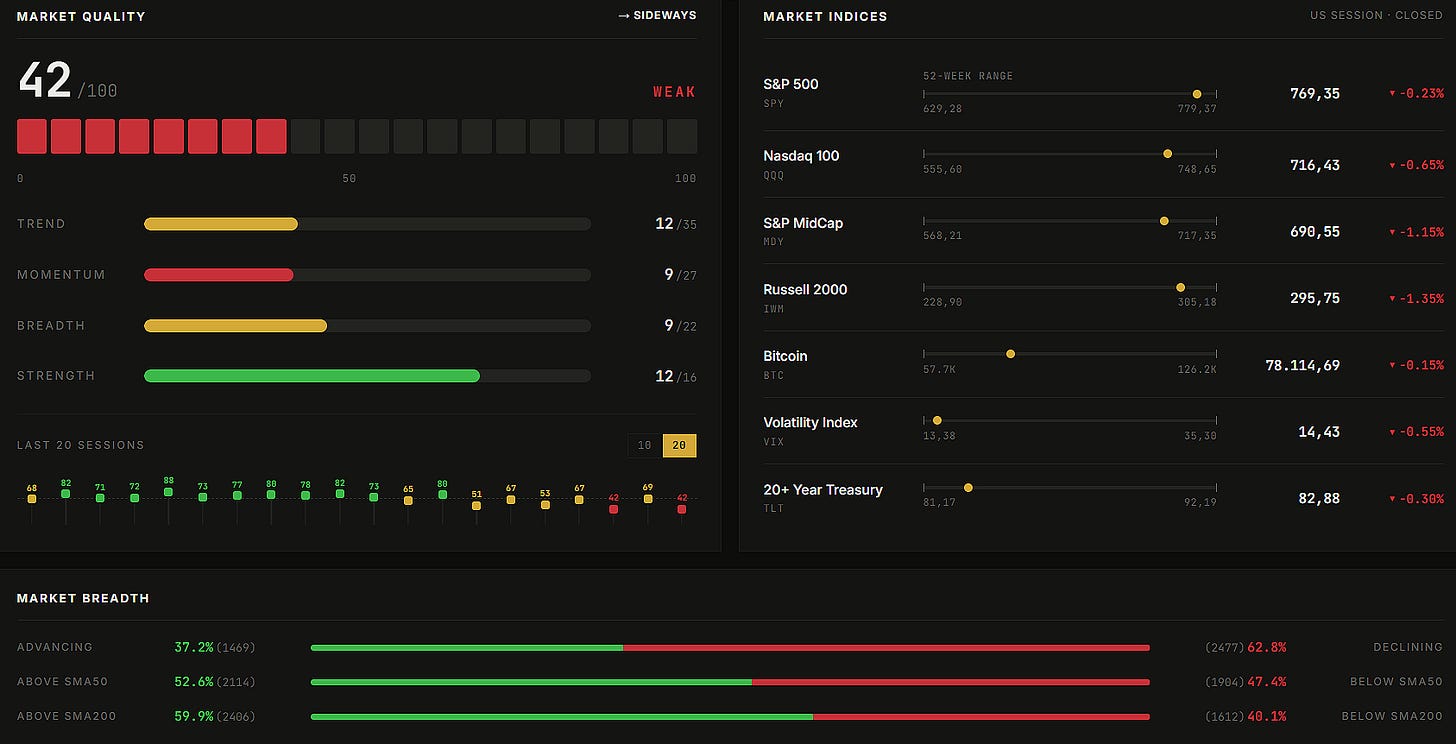
The McClellan Summation is down at 23.6 and sliding toward the bottom of its range. Fewer than 43 percent of stocks are holding above their 40 day average, T2108 (the indicator) has already lost the 10EMA line while the indices sit near the highs taking the applause. Small caps are under every moving average that matters. SPY and QQQ are still standing, though Friday’s candle has failed breakout written all over it.
And the VIX is at 14.4, which gets misread constantly. A sleepy VIX during a slow bleed isn’t comfort. Nothing has been flushed out, nobody has given up.
It’s quiet, and quiet is not the same as safe.
We’re not going to pretend we know what September looks like.
What we will say is that a market with no trend is worse than an outright bear, by a distance. A bear tells you what your job is: get short or sit in cash.
Two options, both legible, both things you can act on. Chop gives you no instruction, sends a fresh invitation every few days, and charges full price every time you take one. Three months of it does more damage than a fast twenty percent drop, and it does it so gradually you can never point to the day it happened.
So we’re defending capital, and we’re comfortable being boring about it.
The app work carries on, and the next research piece should be ready in the coming days. A company with a business model we find genuinely interesting and a risk profile we’re not going to soften up for anybody. We like having something in the book that could be three, five, ten times bigger in a couple of years. The honest price of that shape is that the other number is zero, and we’d rather write that down now than let you find it later.
Until this field gets some texture back in it, we’re keeping our hands where we can see them.
The horses aren’t there.
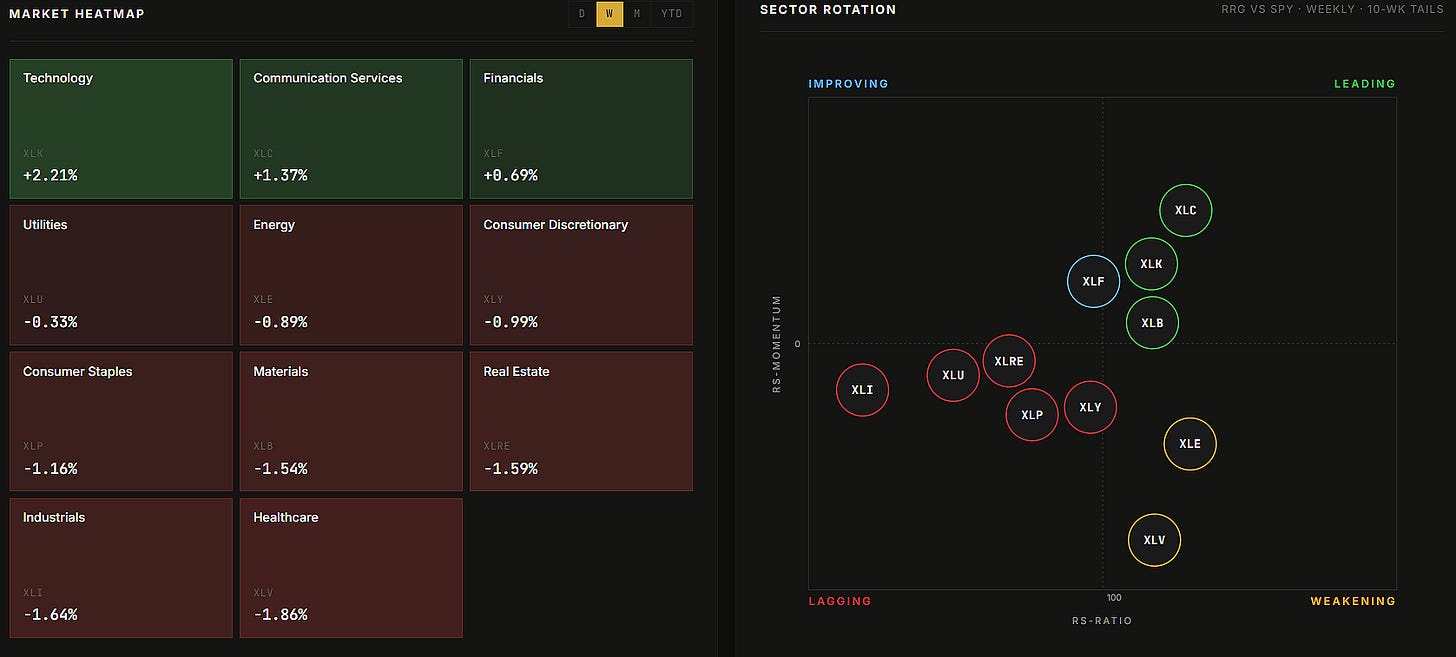
Here’s a look at this week’s market health, with a breakdown of index and sector performance.

We’re currently building the beta version of our app, and it’s already live.
It is not a generic solution for every market participant, but a platform built specifically for swing trading, momentum strategies, and short- to medium-term investing.
You can already sign up, access the beta, and start using it today.
As previously stated, all paid subscribers will receive full access to the platform at no additional cost.

Latest articles:
Each stock carries a risk badge: ⚠️ High | 📊 Medium | 🛡️ Low.
Based on volatility, float, technicals, and fundamentals. Size your positions accordingly.
📈 Free Setup: Make It Count
HONA: Honeywell Aerospace Inc 📊
What they do: An aerospace and defense company
Why watch? Honeywell Aerospace did not go airborne after its spinoff. It went the other way, and its first earnings report as an independent company sent it straight to all-time lows.
The company separated from Honeywell International, now operating as Honeywell Technologies, on June 29, 2026 and trades on the Nasdaq. It supplies avionics, navigation, engines, auxiliary power units, power and thermal systems, and flight control products to commercial aerospace and defense customers, reporting through three segments covering Electronic Solutions, Engines and Power Systems, and Control Systems.
The revenue model is simple and it has two halves that behave nothing alike. HONA earns money when equipment goes onto a new aircraft or defense platform, and it earns money again from parts, repair, overhaul, software and upgrades throughout that equipment’s operating life. The second half is where the profit lives. Selling a unit onto a new airframe is competitive and margin-thin, since airframers negotiate hard and suppliers accept it to secure the position. Servicing that same unit for the following three decades is neither competitive nor thin. The long-term growth runway therefore reduces to the size of the installed base: the more equipment flying, the more maintenance events arise. When a mechanical component wears or reaches a service interval, the operator needs the correct part, the technical data, the repair procedure and certified support, and there is generally exactly one supplier who can provide all four. Electronic systems generate a parallel stream through software, compliance, safety and functionality updates.
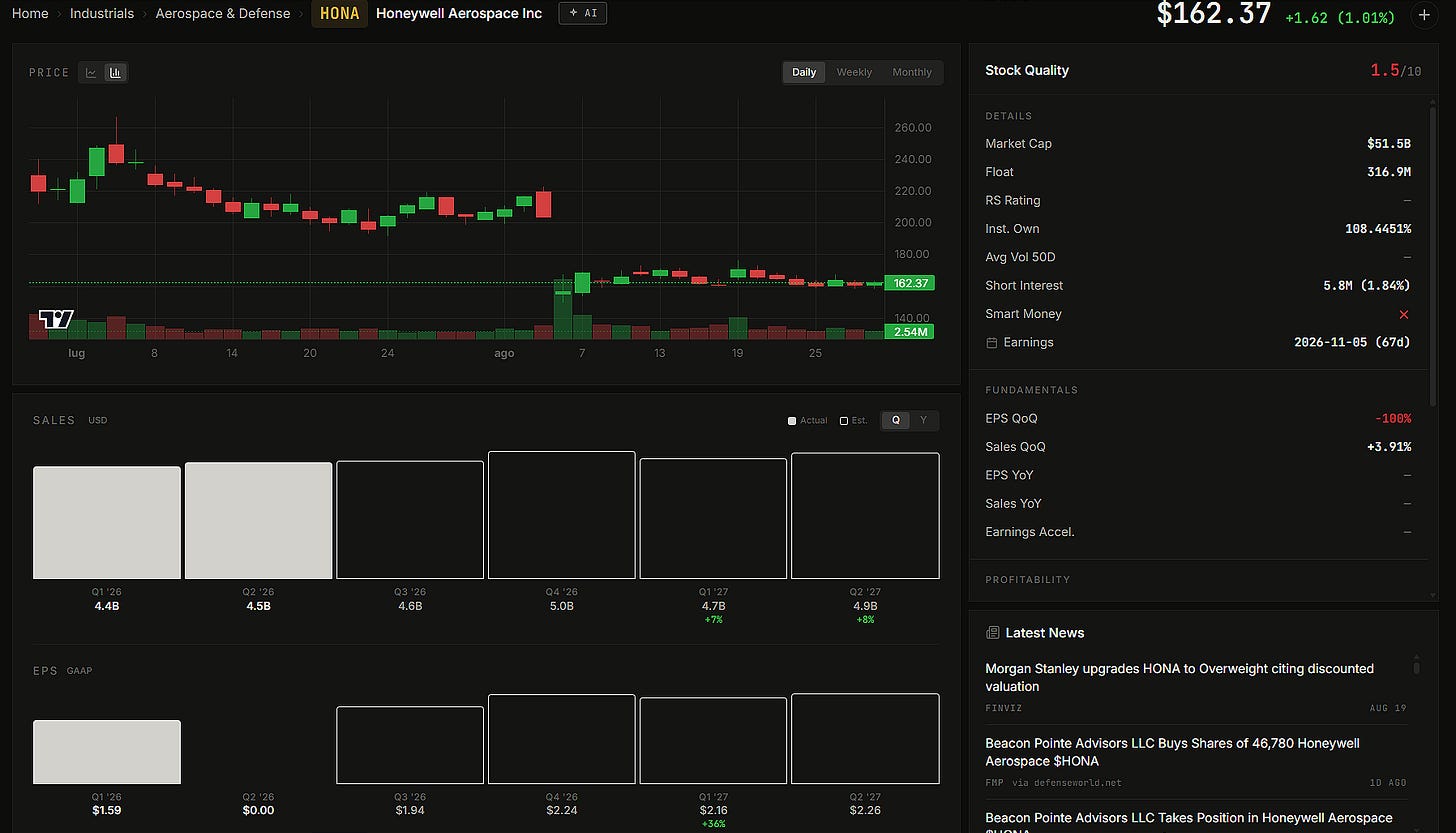
The August 5 report broke that logic in the short term, and the mechanism is worth understanding because it explains both the severity of the reaction and why the damage may prove temporary. Second quarter sales were $4.5 billion, up 5% year over year on both a reported and an organic basis. Adjusted EBIT came in at $995 million, down 7%. Adjusted earnings per share fell to $1.87 from $2.75, weighed down by roughly $100 million of separation-related costs and inventory obsolescence charges tied to the spinoff itself.
Then came the guidance, which is what actually did the damage. Full-year organic sales growth was cut to a range of 4% to 5% from a prior 7% to 9%, a midpoint of roughly 4.5% for a company that had projected 7% to 9% at its market debut barely five weeks earlier. Adjusted EBIT guidance was reduced by approximately $300 million at the midpoint to a range of $4.35 billion to $4.45 billion. Second half free cash flow guidance was maintained.
The cause is not demand. Demand is fine. The constraint is precision castings, the specialty metal components that go into engines and mechanical systems and that remain among the most structurally constrained inputs anywhere in commercial aerospace. HONA cannot produce enough parts, and when parts are scarce they have to go to Boeing and Airbus to keep production lines moving, because contractual obligations to the airframers come first. Every casting diverted to a new aircraft is a casting unavailable to the aftermarket, and the aftermarket is the high-margin business. That is the whole reason 5% sales growth produced a 7% decline in operating profit. Management acknowledged that corrective actions have taken longer than expected, particularly across the mechanical supply base, and is targeting a materially stronger 2027 as new suppliers, additional manufacturing capacity and tooling come online, having already added alternative sources across the constrained parts.
The underlying business does not appear broken. Commercial aftermarket increased 8% and Defense and Space sales grew 3%. A company with a growing aftermarket and an intact installed base working through a supply bottleneck is a fundamentally different proposition from a company losing customers.
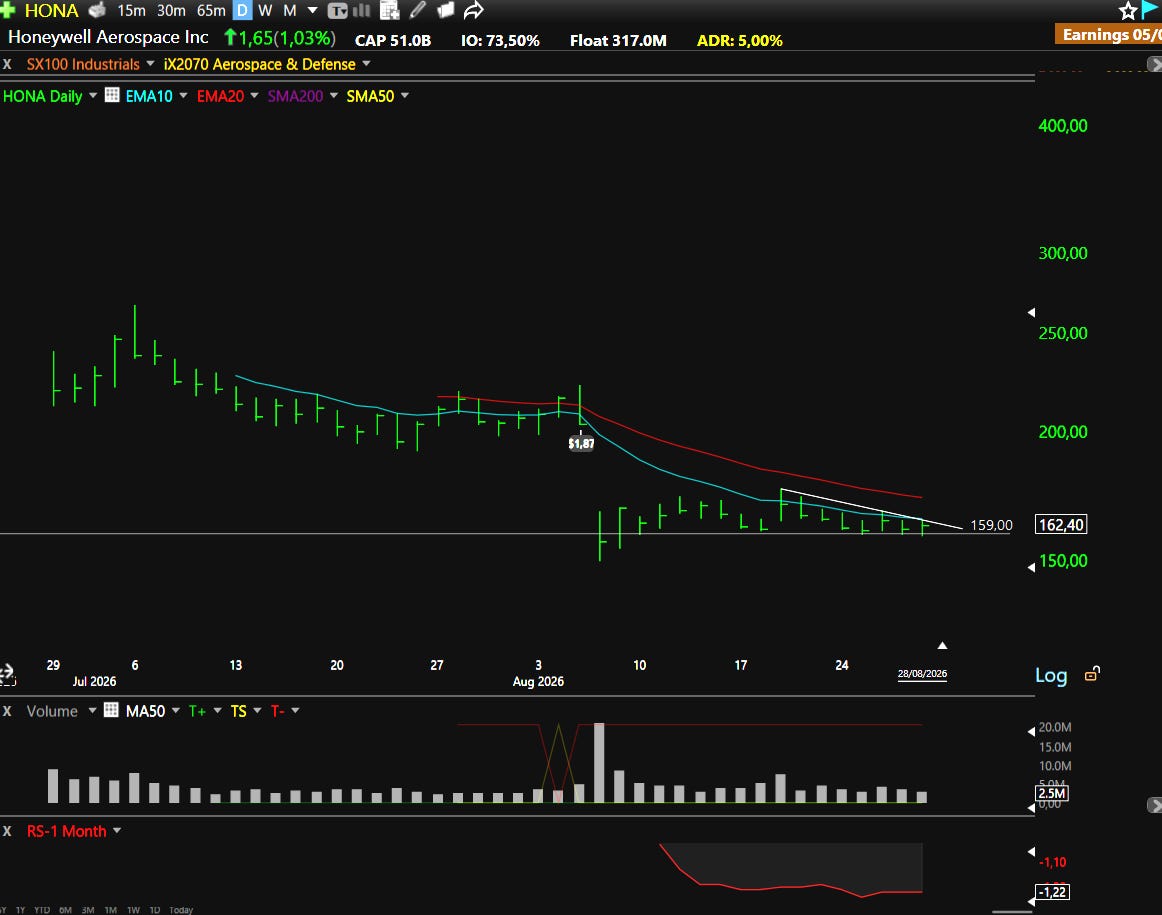
Technical Outlook: The stock plunged to a low of $150.00 after earnings and has recouped enough to sit just above $160.00. $159.00 is the first key level formed since the drop, already touched multiple times over the past several weeks and holding on each attempt. The possibility of a breakdown is clearly present and should not be argued away. But if the breakdown fails to materialize, a break of the overhead downtrend line on volume would produce a strong move in the opposite direction, because there is very little supply that needs absorbing between here and where the stock traded before the report. Friday delivered the first piece of evidence: the stock closed green with the market red, and it was the best performing name in the entire space group that session, the only one higher alongside LHX and SPCX while everything else in the group was down substantially. An average daily range of 5.00% is decent for a stock of this size and float, which makes the risk-reward workable at this spot if the broader market decides to cooperate.

Why We Don’t Wait for Sunday
Markets don’t move on your schedule. The best low-risk entries don’t announce themselves politely and wait for the weekend newsletter.
They show up when they show up. And if you’re not positioned, you miss them.
Paid members get real-time alerts: exact entries, stops, position sizing, and the thesis behind every trade. The same information we use to manage our own capital.
Free members get just one pick on Sunday.
Does that sound like an edge to you?
What’s Inside Premium
Free Access to TradeDeck
Premium members get early access to TradeDeck, the trading platform we’re building. The value of the platform alone already exceeds the cost of the subscription.
Watchlist Elite (5-7 Stocks)
Each selection undergoes rigorous financial analysis, technical evaluation, and strategic assessment.
Full Portfolio Transparency
Every position we hold. Entry price. Current P&L. Stop level. Real money, real risk.
Real-Time Trade Alerts (Chat Access)
This is where the edge lives. Exact entries, stops, and position sizing. Real-time. No lag
Quick Picks (5 Names)
Additional setups that just missed our main criteria but are worth watching.
Chat Access
See our thought process in real time. Ask questions. Watch how we manage risk.
The Tools We Actually Use
Member discounts on TC2000, Fiscal.ai, and other platforms: same tools, better pricing.
What Paid Members Say:
We’re entrepreneurs first, traders second. We’ve sat in the CEO chair. We know what real execution looks like and how to spot it.
€39/month or 299€/year. Less than one losing trade. Cancel anytime.
Portfolio updates and new positions:
Il resto di questo pezzo: i nomi, i livelli, la gestione.The rest of this piece: the names, the levels, how we manage it.
Ogni domenica dieci titoli con i livelli scritti, la lettura del mercato e la chat in cui pubblichiamo entrate e uscite mentre le facciamo. Disdici quando vuoi dal tuo account Substack.Every Sunday, ten names with the levels written down, the market read, and the chat where we post entries and exits as we make them. Cancel any time from your Substack account.
Già abbonato?Already a subscriber? Apri l'articolo su Substack →Open the article on Substack →