

Wall Street Radar: Stocks to Watch Next Week
💼 Volume 92

Nobody’s Going Anywhere (Yet)
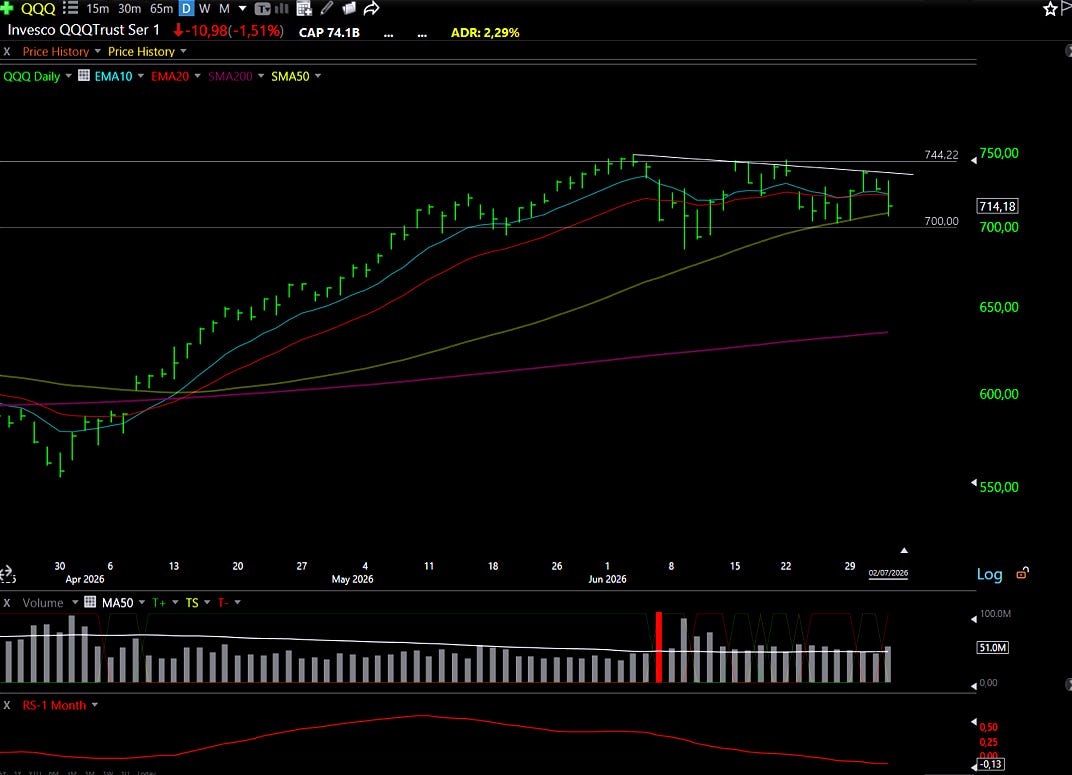
Since late May, the market has done exactly one thing well: nothing.
A channel, clean and stubborn, holding both edges for weeks now. Today, it gets interesting again. The Nasdaq is sitting right on its 50-day moving average, and how it closes matters more than most people trading it realize. Lose that level, and we could be looking at a genuinely bearish stretch. Hold it, and the range simply continues, one more week of the same argument between buyers and sellers who can’t quite win.
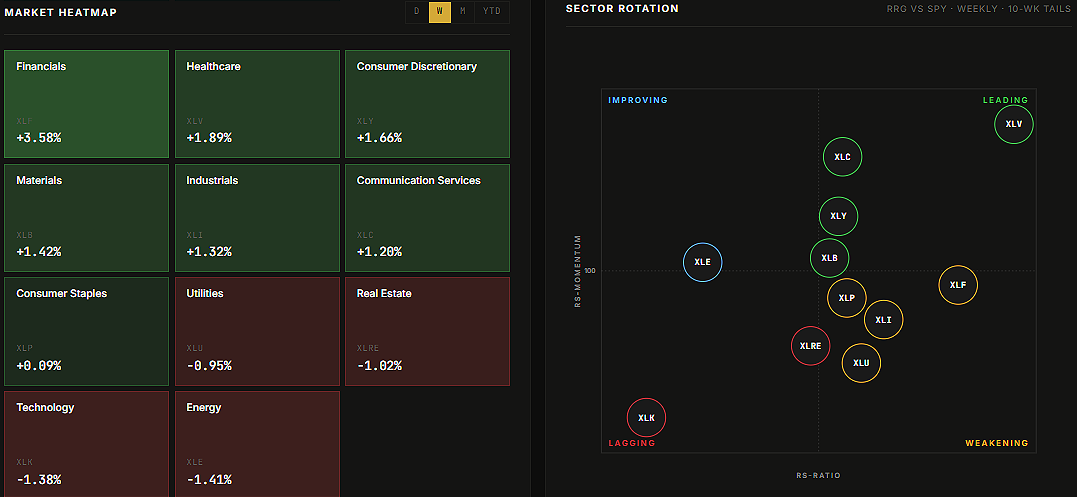
The more encouraging piece sits elsewhere. SPY and IWM are still bullish, still behaving like indices that want higher prices eventually. Put that next to a Nasdaq fighting for its moving average, and a question starts forming that we can’t ignore. What if the second half of the year gets carried by something other than AI? What if the sectors and industries keeping the broader market up have nothing to do with chips, data centers, or the next model release?
There’s a catch, and it’s the same catch that’s been shaping the watchlist for two weeks now. The obvious rotation, the one everyone can see and everyone’s already read about, healthcare being the loudest example, started well before today. That money moved two weeks ago. The result is a lot of names in those defensive corners now sitting extended, stretched past the point where a clean setup is easy to find.
Meanwhile, tech, the place where setups used to be everywhere, is dealing with real structural damage from the last few sessions. Charts that looked fine a week ago are broken now, and broken charts don’t fix themselves overnight.
Put those two things together, and you get a watchlist that gave us a harder time than usual. We still found something. We always do. But nobody should mistake this for an easy week of hunting. It wasn’t.
Behind the scenes, a different kind of work ate most of our attention.
We spent this week tearing down and rebuilding the visual side of the platform ahead of the full beta launch, and we’re hoping to close out the mobile version over the weekend. That means the screenshots you’ll see this time look different from what you’re used to. Consider it a preview of where things are headed rather than a finished product.
Because next week the real work starts.
Two pieces, both bigger than anything we’ve shipped so far.
The first is a full rebuild of the Megatrends page. Same idea, thematic baskets built around real trends, but with far more depth behind each one instead of just a list of tickers sitting there with no context.
The second is the one we’ve been sitting on for a while, and it’s the one we’re most nervous and most excited about.
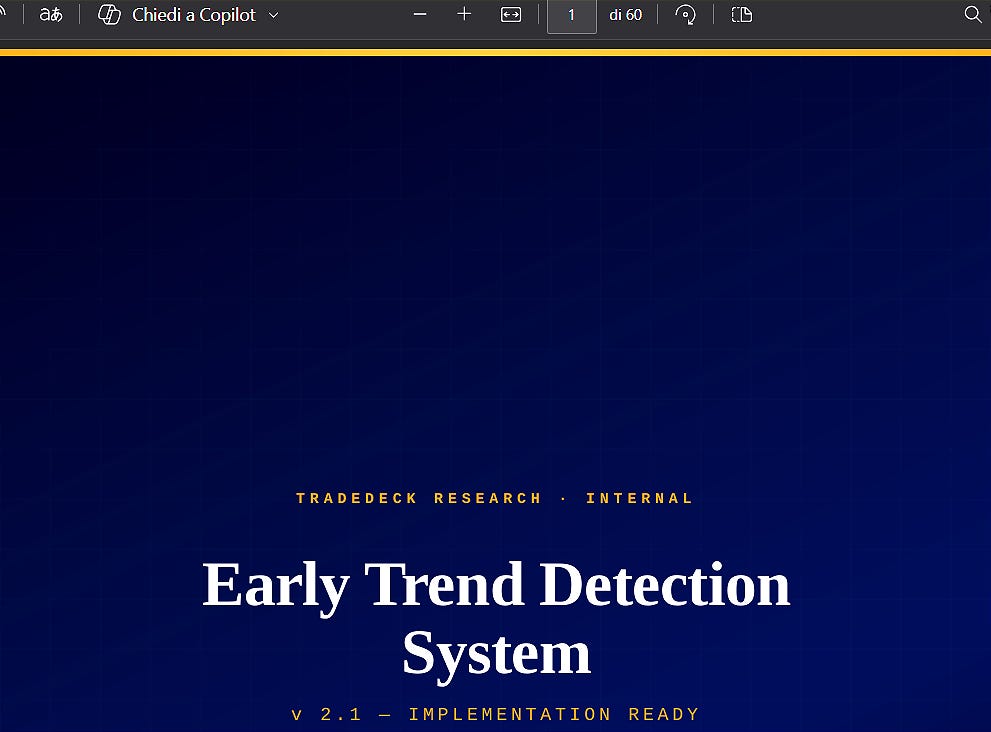
We’re calling it the ETDS, the Early Trend Detection System.
The idea is simple to say and brutally hard to build. A system that reads across news, earnings, articles, charts, calls, papers, individual stocks, and everything already sitting inside our own data, and from all of that starts forming early ideas about trends and themes before they’re obvious to anyone else.
Sixty pages of research went into the formulas and processes behind it. Sixty pages that we hope turn into something genuinely useful for swing traders and momentum investors trying to size up how big a trend actually is before the crowd shows up.
Here’s why it matters.
Think back to the Memory theme, names like Sandisk (SNDK), Micron (MU), Seagate (STX). Anyone who caught that early and understood just how powerful the move was going to be could have held a real position through the middle of the year instead of treating it as a quick in-and-out trade. That’s just one example, but it points to something bigger. A lot of trades fail not because the entry was wrong, but because there was never enough conviction behind them. Not enough to open the position with real size, and just as often, not enough to stay in it when the first scare hits and fear takes over. If a tool can help close that gap, even a little, it’s worth sixty pages and then some.
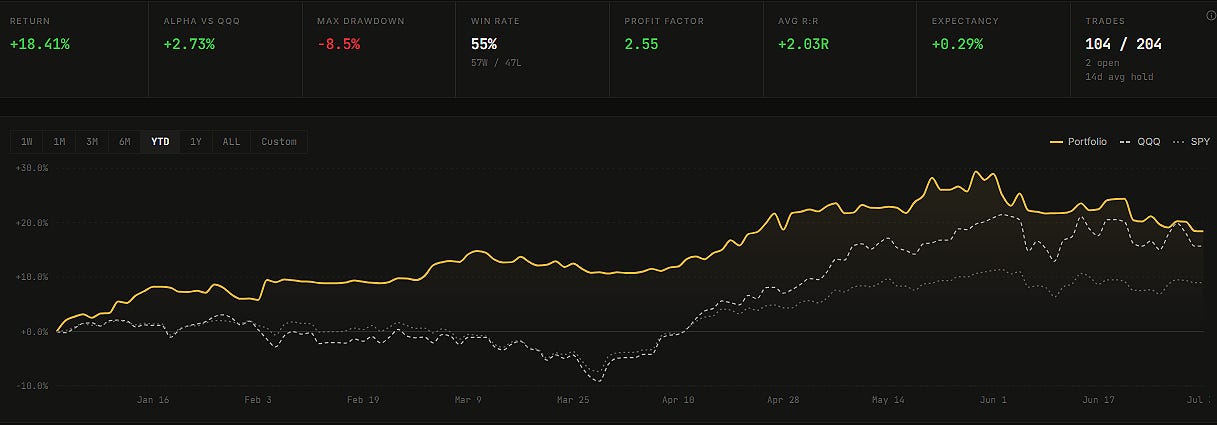
Back to this week’s numbers, because we owe you those, too.
Three entries, all of them well timed, all of them setups we liked walking in. Two came right back out almost immediately. Only Monday’s position is still sitting in the portfolio.
We stayed mostly in cash through all of it, and we’re leaning even more defensive than we were last week. Until the tape gives us something worth committing to, that’s exactly where we intend to stay.
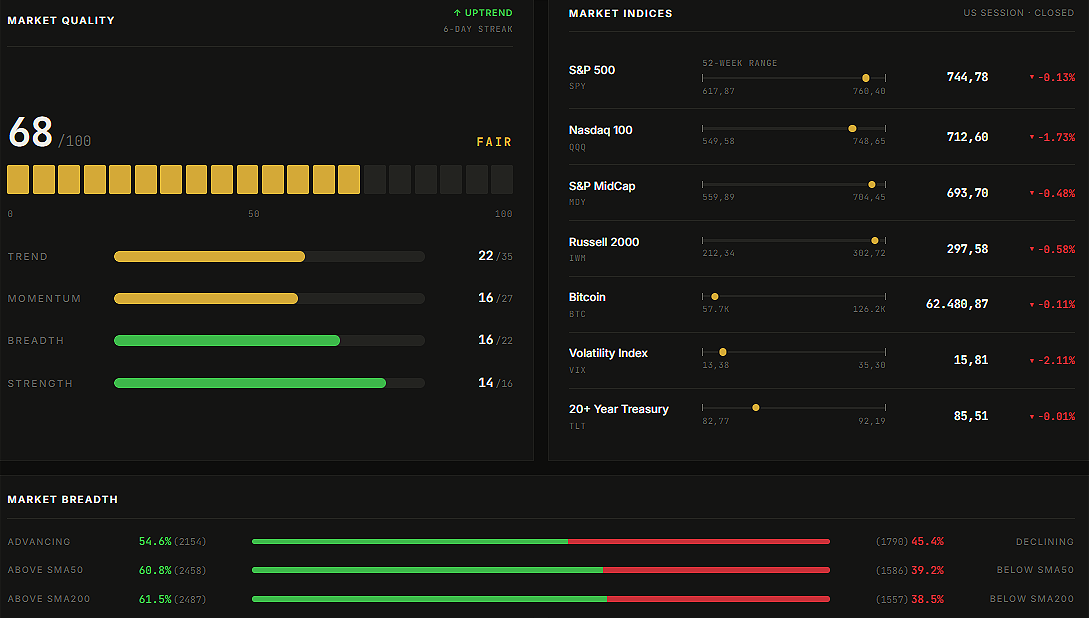
Here’s a look at this week’s market health, with a breakdown of index and sector performance.

We’re currently building the beta version of our app, and it’s already live.
It is not a generic solution for every market participant, but a platform built specifically for swing trading, momentum strategies, and short to medium-term investing.
You can already sign up, access the beta, and start using it today.
As previously stated, all paid subscribers will receive full access to the platform at no additional cost.
Latest articles:


Each stock carries a risk badge: ⚠️ High | 📊 Medium | 🛡️ Low.
Based on volatility, float, technicals, and fundamentals. Size your positions accordingly.
📈 Free Setup: Make It Count
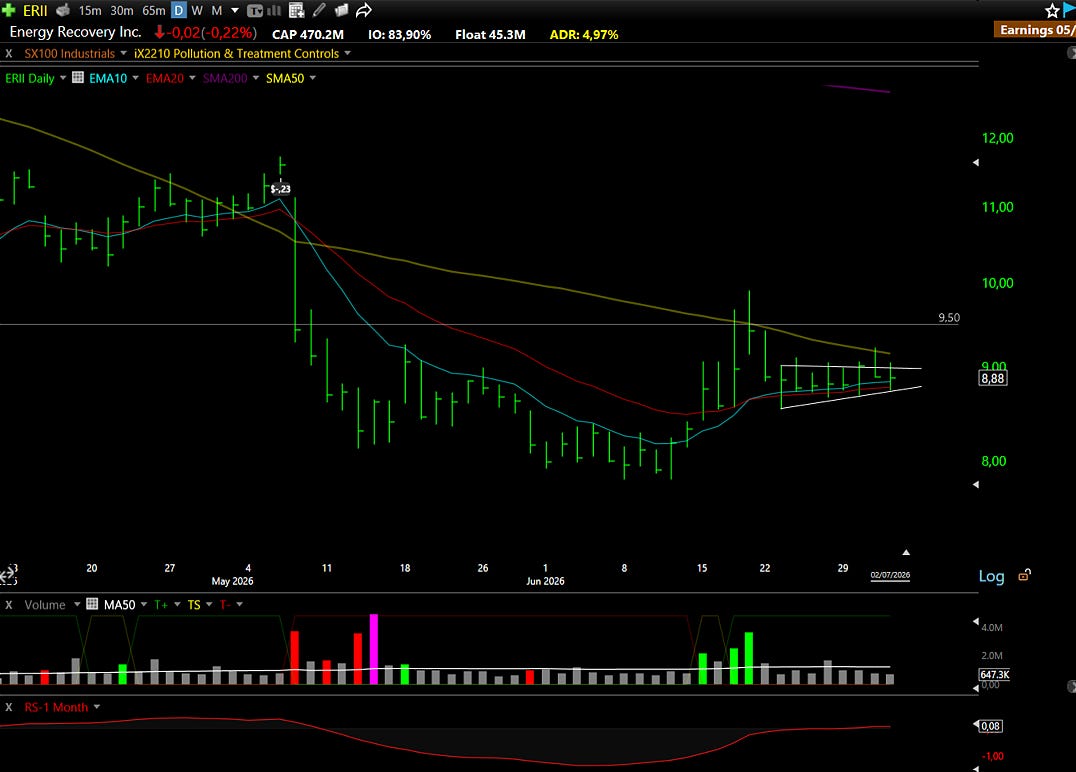
ERII: Energy Recovery Inc 📊
What they do: An industrial technology company whose core product dramatically reduces the energy cost of seawater desalination
Why watch? Energy Recovery has spent the past several months being repriced for the wrong reasons, which is exactly the kind of setup worth paying attention to.
The product at the center of the business earns its place in the water infrastructure stack by solving a fundamental physics problem. Seawater reverse osmosis works by forcing seawater through semi-permeable membranes under extremely high pressure, separating the salt from the water. The concentrated brine discharged from that process still carries most of the pressure energy that was used to push the seawater through. In traditional systems, that energy is wasted. The PX Pressure Exchanger captures it and returns it directly to the incoming seawater stream before it enters the high-pressure pumps, cutting the plant’s total energy consumption by up to 60%. That is not a marginal efficiency improvement. In many geographies, it is the difference between desalination being economically viable at scale and being prohibitively expensive. The product commands gross margins above 60%, accounts for over 90% of revenue, and has no meaningful competition in its specific niche. The business has the economics of a high-margin IP licensing operation despite being classified and priced as an industrial manufacturer.
The stock has fallen approximately 50% from its February highs, and the reasons are specific and largely temporary. The Middle East represents roughly half of the company’s revenue, and that concentration became acutely problematic when the Iran conflict disrupted project timelines and forced management to remove full-year guidance entirely. Two consecutive earnings reports that disappointed against already-reduced expectations, combined with CEO and CFO departures in close succession, compressed the valuation multiple aggressively. The market sold the uncertainty, not the business.
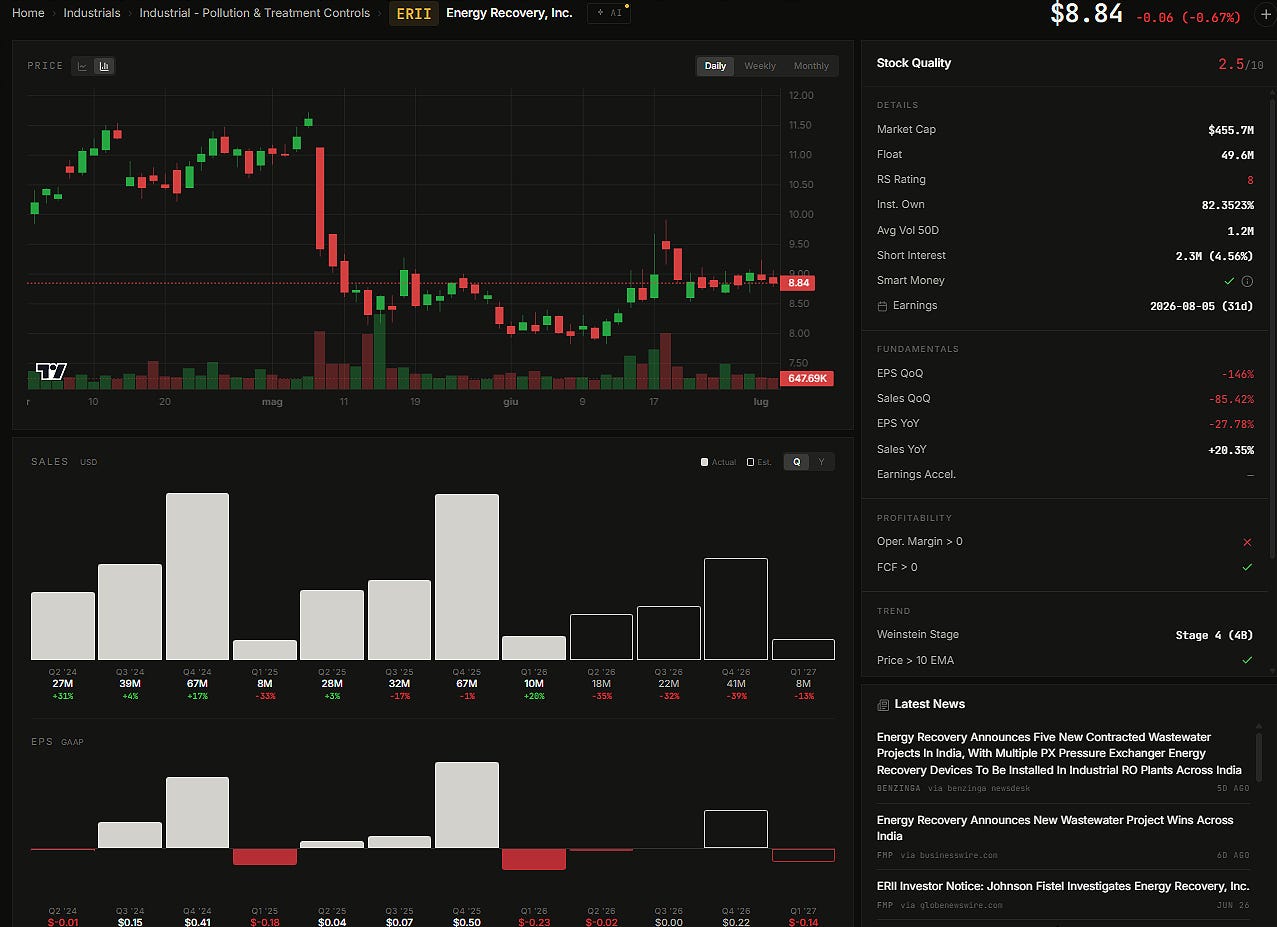
What the selloff missed is that the underlying demand drivers are not just intact but growing. Q1, historically the company’s weakest seasonal quarter, still grew 20% year over year. The net loss reported for that quarter came from a one-time charge related to terminating the CO2 refrigeration side project, a capital allocation decision to stop pursuing a product line that was consuming resources without producing returns. Strip that charge out, and the core business performed as expected. Q4 2025 was a record quarter at $66.9 million in revenue with a 67% gross margin. The balance sheet is a genuine fortress: $77 million in net cash, a 9x current ratio, minimal debt, approximately $27 million in trailing free cash flow, and a buyback program running at roughly a 9% yield on the current share price. The company is paying you to wait.
Four structural vectors make the current price genuinely interesting beyond the Middle East situation normalizing. Global water scarcity is intensifying as rivers and aquifers decline while population growth, industrialization, and AI infrastructure all pull harder on a shrinking supply, with desalination as the primary engineered backstop. The conflict itself demonstrated that water infrastructure is a strategic military asset, and the Gulf states that had plants damaged are now under direct pressure to harden, decentralize, and build more capacity rather than less, which means more PX sales into exactly the region where the stock has been punished. The Gulf AI data center build-out, which PwC projects will triple to roughly 3.3 gigawatts of compute capacity by 2030, requires enormous cooling water volumes in a region where up to 90% of fresh water comes from desalination, making Energy Recovery’s product the constraint on where that compute can actually be deployed. Management is not telling that story yet, but it is there. And the industrial wastewater segment, which the company has carved out as its own reporting unit at roughly 6% of current revenue, addresses the other end of the AI water story: semiconductor fabs and data centers discharge process water that requires treatment before release, using the same pressure exchange technology at the same margin profile.
Against peers in the water technology sector, Xylem, Badger Meter, and Franklin Electric all trade at 28 to 31 times trailing earnings. Energy Recovery trades at roughly 24 times, with the highest gross margin in the peer group and the smallest market cap. The gap is almost entirely explained by the Middle East concentration and the leadership transition, neither of which changes the fundamental quality of the product or the demand environment it operates in.
Technical Outlook: The stock is near multi-year lows and sitting in a well-defined technical demand zone. The asymmetry here comes from the balance sheet: with $77 million in net cash and strong free cash flow, the company is not at risk in any scenario that involves normal operations, which removes the tail risk that typically makes deep drawdowns dangerous in small caps. The setup is one where the downside catalyst is already fully reflected in the price, and any normalization of the Middle East situation or announcement of new leadership becomes the repricing trigger.

Why We Don’t Wait for Sunday
Markets don’t move on your schedule. The best low-risk entries don’t announce themselves politely and wait for the weekend newsletter.
They show up when they show up. And if you’re not positioned, you miss them.
Paid members get real-time alerts: exact entries, stops, position sizing, and the thesis behind every trade. The same information we use to manage our own capital.
Free members get just one pick on Sunday.
Does that sound like an edge to you?
What’s Inside Premium
Free Access to TradeDeck
Premium members get early access to TradeDeck, the trading platform we’re building. The value of the platform alone already exceeds the cost of the subscription.
Watchlist Elite (5-7 Stocks)
Each selection undergoes rigorous financial analysis, technical evaluation, and strategic assessment.
Full Portfolio Transparency
Every position we hold. Entry price. Current P&L. Stop level. Real money, real risk.
Real-Time Trade Alerts (Chat Access)
This is where the edge lives. Exact entries, stops, and position sizing. Real-time. No lag
Quick Picks (5 Names)
Additional setups that just missed our main criteria but are worth watching.
Chat Access
See our thought process in real time. Ask questions. Watch how we manage risk.
The Tools We Actually Use
Member discounts on TC2000, Fiscal.ai, and other platforms. Same tools, better pricing.
What Paid Members Say:
We’re entrepreneurs first, traders second. We’ve sat in the CEO chair. We know what real execution looks like and how to spot it.
€39/month or 299€/year. Less than one losing trade. Cancel anytime.
Portfolio updates and new positions:
