

🚀 Wall Street Radar: Stocks to Watch Next Week
💼 Volume 85

The First Crack in a One-Sided Rally
This week, the market finally started to ease off.
Nothing dramatic, but the signs had been building for at least the past ten days. The shift was already visible beneath the surface. As we pointed out last week, the rally had become increasingly narrow, with tech acting as the only real engine of upside while most other sectors were moving sideways, lacking any meaningful bullish momentum.
That kind of imbalance rarely sustains itself for long.
Our breadth indicators had been warning about this for a while. Since early May, we have started to see the first lower high forming, followed by a sharp deterioration over the past two weeks. In particular, the McClellan Summation Index has been cut in half over that period, a clear sign that participation was fading even as prices continued to push higher.
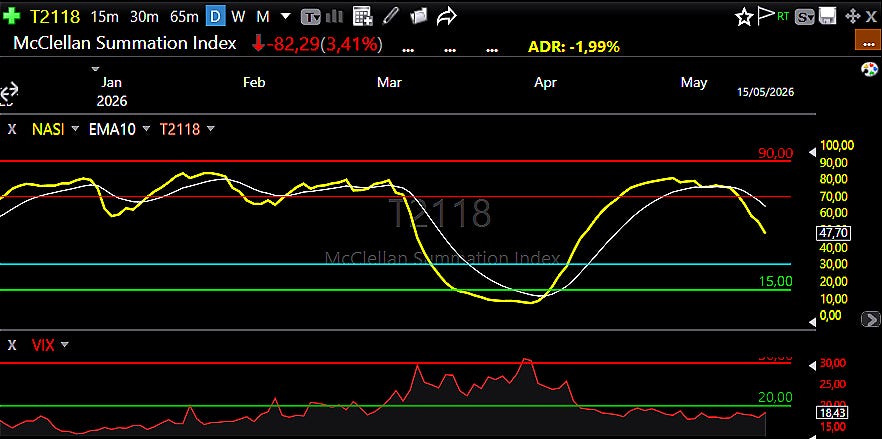
We are currently working on integrating this metric into our dashboard as an additional layer of analysis. It is an extremely powerful tool, but one that needs to be handled with care. It tends to be very effective at identifying potential tops and bottoms, but it loses reliability in choppy environments. For that reason, we treat it strictly as a secondary indicator, something that supports the broader read rather than drives it.
On the trading side, the week was relatively uneventful.
We initiated a hedge position through SOXS to partially offset the drawdown across our open positions. The idea was simple: create a bit of breathing room, allowing our remaining trades to develop without being forced into premature exits.
Then on Friday, we opened a new position showing exceptional relative strength. It closed firmly in the green, despite a market that finished deeply in the red. That kind of divergence is always worth paying attention to.
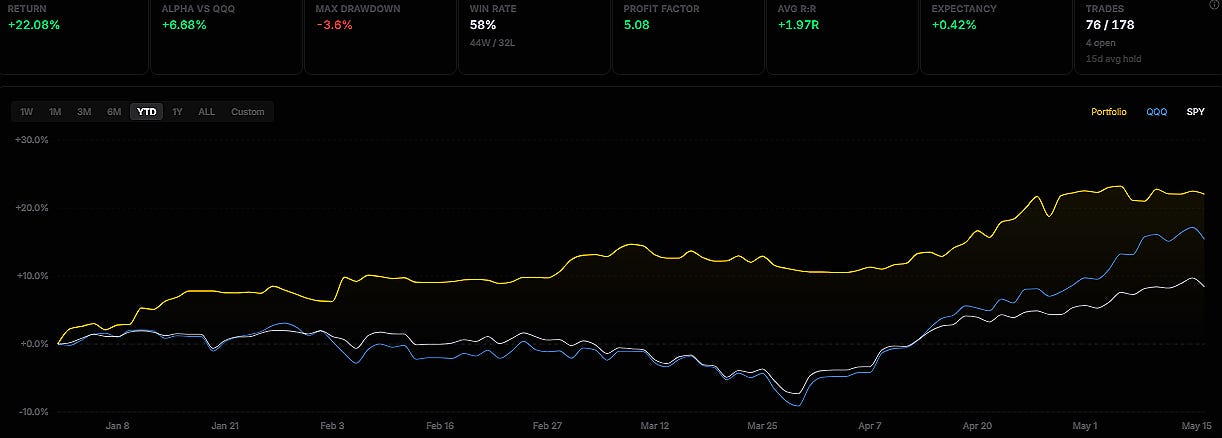
Overall, the portfolio stayed broadly in line with the market in terms of performance.
Not much deviation, which, given the conditions, is a result we are comfortable with.
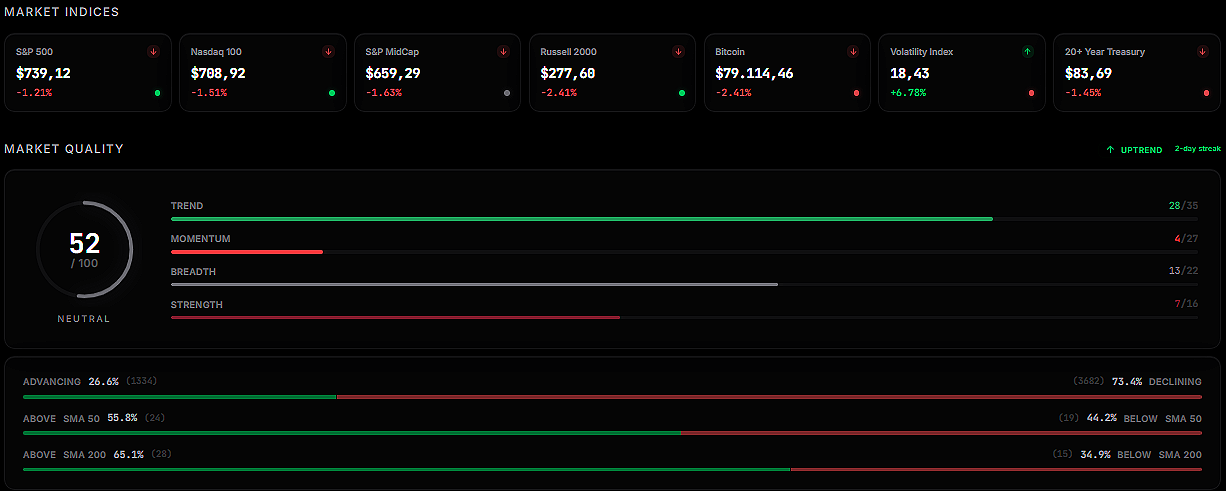
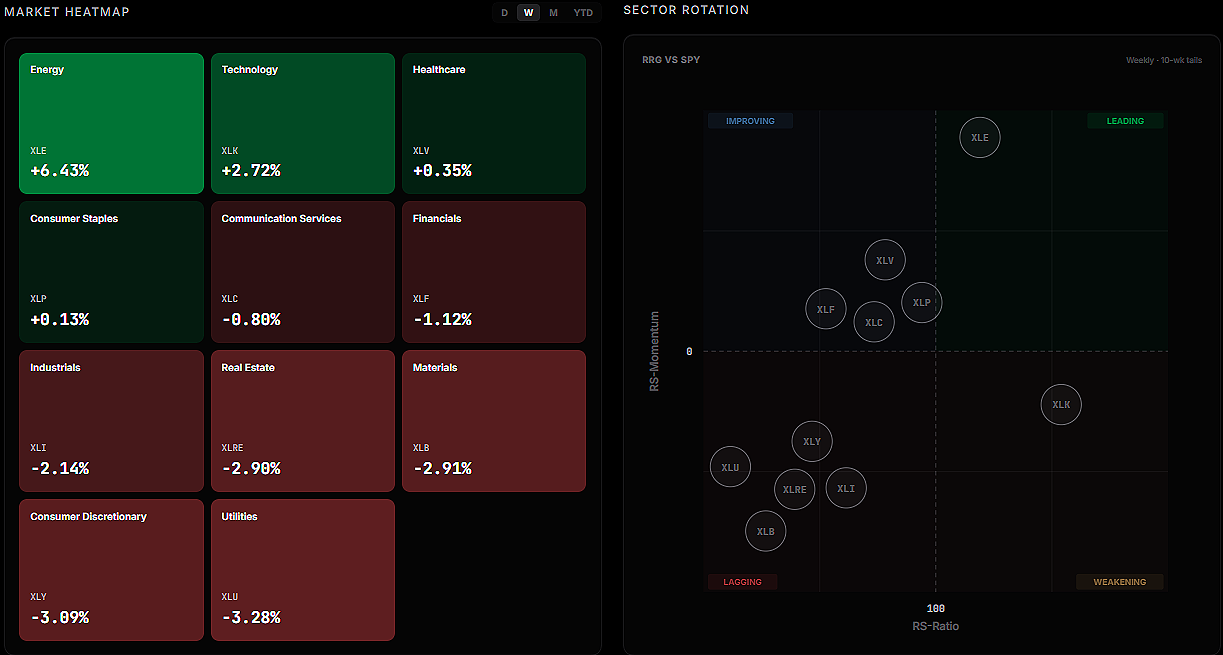
Here’s a look at this week’s market health, with a breakdown of index and sector performance.

We’re currently building the beta version of our app, and it’s already live.
It is not a generic solution for every market participant, but a platform built specifically for swing trading, momentum strategies, and short to medium-term investing.
You can already sign up, access the beta, and start using it today.
As previously stated, all paid subscribers will receive full access to the platform at no additional cost.
Latest articles:


Each stock carries a risk badge: ⚠️ High | 📊 Medium | 🛡️ Low.
Based on volatility, float, technicals, and fundamentals. Size your positions accordingly.
📈 Free Setup: Make It Count
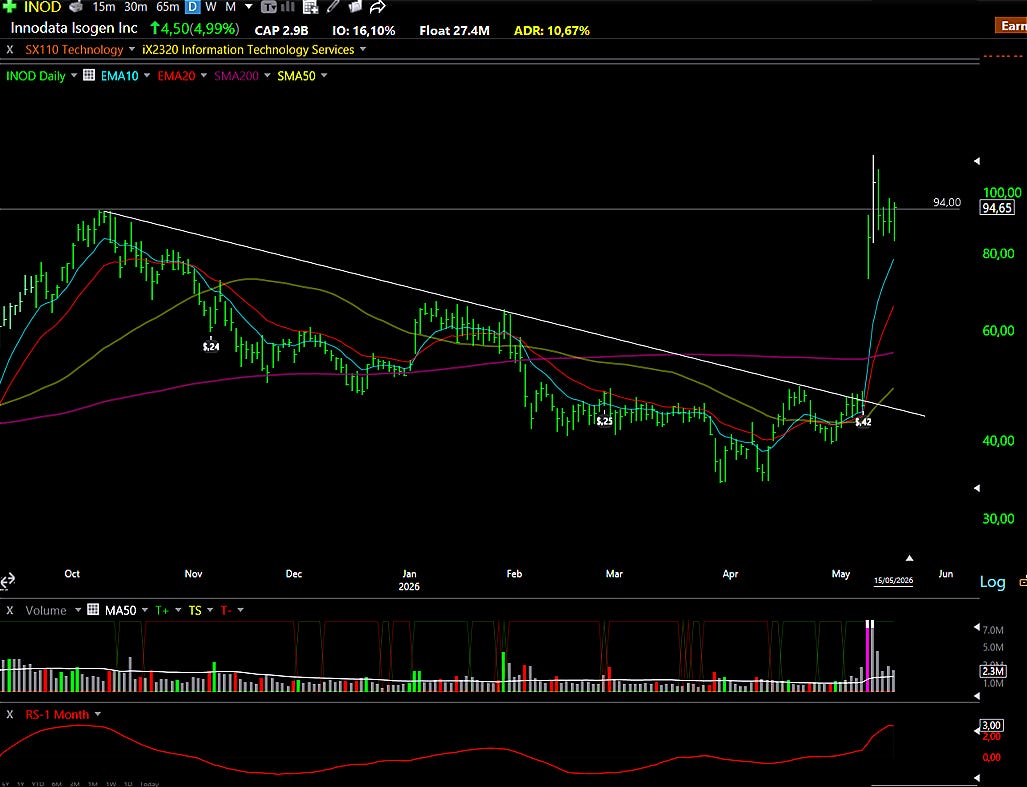
INOD: Innodata Isogen Inc ⚠️
What they do: A data engineering company
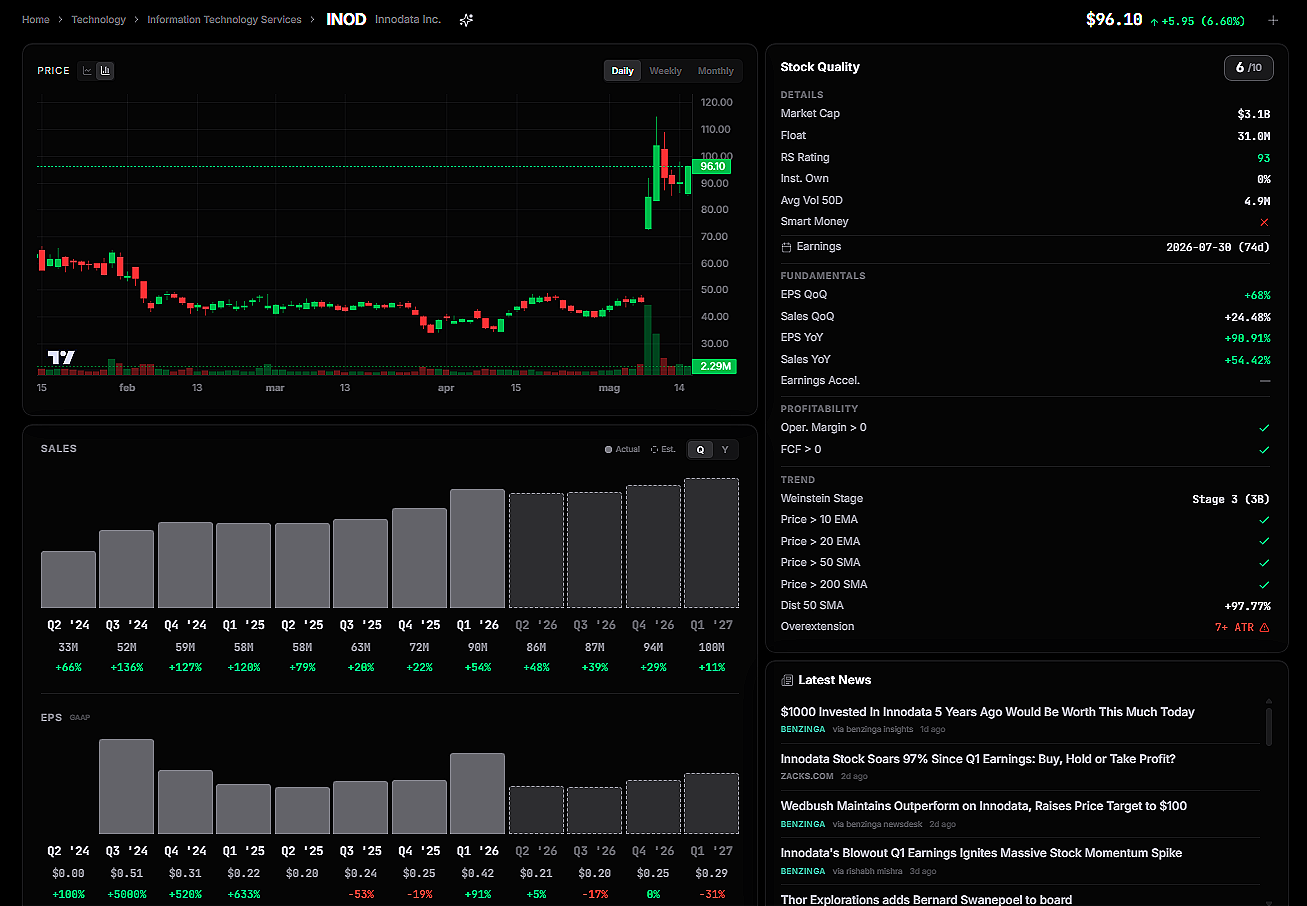
Why watch? Innodata sits at a genuinely interesting intersection of old-school data services and the new AI economy. The company has spent decades building expertise in structuring and processing information, and that foundation has become surprisingly valuable as Big Tech races to train increasingly sophisticated AI models. Put simply, AI systems need enormous quantities of high-quality, carefully labeled data to learn from, and Innodata is one of the companies doing that work behind the scenes.
The financial results speak for themselves. The most recent quarter was described by management as “a record quarter for Innodata, and it was record-setting by a wide margin.” Earnings per share came in 430% above analyst expectations, revenue beat by 18%, and the company raised its full-year 2026 growth guidance to above 40%, up from the 35% target issued just ten weeks earlier. Revenue, which hovered in a range for years, has now entered a completely new trajectory. Analysts project growth from $170 million to $454 million by fiscal year 2027, implying annualized revenue growth of roughly 39% over the next three years. For context, the company has already averaged over 35% annual revenue growth across the past years, so this isn’t a projection built on wishful thinking.
What makes Innodata particularly interesting is its positioning in agentic AI development. Agentic AI refers to systems capable of taking autonomous actions and making decisions, rather than simply responding to prompts. Building these systems requires rigorous stress-testing and red-teaming, a process where humans deliberately try to break or manipulate the AI to identify weaknesses. Innodata’s experience in this area creates a meaningful competitive advantage that is difficult to replicate quickly.
The balance sheet is solid, and with a float of approximately 30 million shares, relatively modest buying pressure can translate into outsized price moves.
Technical Outlook: On earnings day, the stock printed what traders call a Power Earnings Gap on volume roughly multiple times the daily average, the highest trading volume in five years. Since then, the stock has pulled back modestly, but the pullback has been notably shallow given the magnitude of the move, suggesting strong underlying demand. In a session where the Nasdaq closed deeply in the red, INOD finished up 5%, a clear signal of exceptional relative strength. Near-term support sits in the $93 to $94 range, with resistance at $97 to $98. The 10-day exponential moving average is catching up to the price. A couple more days of consolidation on declining volume would set up a lower-risk entry point ahead of what could be a meaningful second leg higher.

Why We Don’t Wait for Sunday
Markets don’t move on your schedule. The best low-risk entries don’t announce themselves politely and wait for the weekend newsletter.
They show up when they show up. And if you’re not positioned, you miss them.
Paid members get real-time alerts: exact entries, stops, position sizing, and the thesis behind every trade. The same information we use to manage our own capital.
Free members get just one pick on Sunday.
Does that sound like an edge to you?
What’s Inside Premium
Free Access to TradeDeck
Premium members get early access to TradeDeck, the trading platform we’re building. The value of the platform alone already exceeds the cost of the subscription.
Watchlist Elite (5-7 Stocks)
Each selection undergoes rigorous financial analysis, technical evaluation, and strategic assessment.
Full Portfolio Transparency
Every position we hold. Entry price. Current P&L. Stop level. Real money, real risk.
Real-Time Trade Alerts (Chat Access)
This is where the edge lives. Exact entries, stops, and position sizing. Real-time. No lag
Quick Picks (5 Names)
Additional setups that just missed our main criteria but are worth watching.
Chat Access
See our thought process in real time. Ask questions. Watch how we manage risk.
The Tools We Actually Use
Member discounts on TC2000, Fiscal.ai, and other platforms. Same tools, better pricing.
What Paid Members Say:
We’re entrepreneurs first, traders second. We’ve sat in the CEO chair. We know what real execution looks like and how to spot it.
€39/month or 299€/year. Less than one losing trade. Cancel anytime.
Portfolio updates and new positions:
