

🚀 Wall Street Radar: Stocks to Watch Next Week
💼 Volume 50

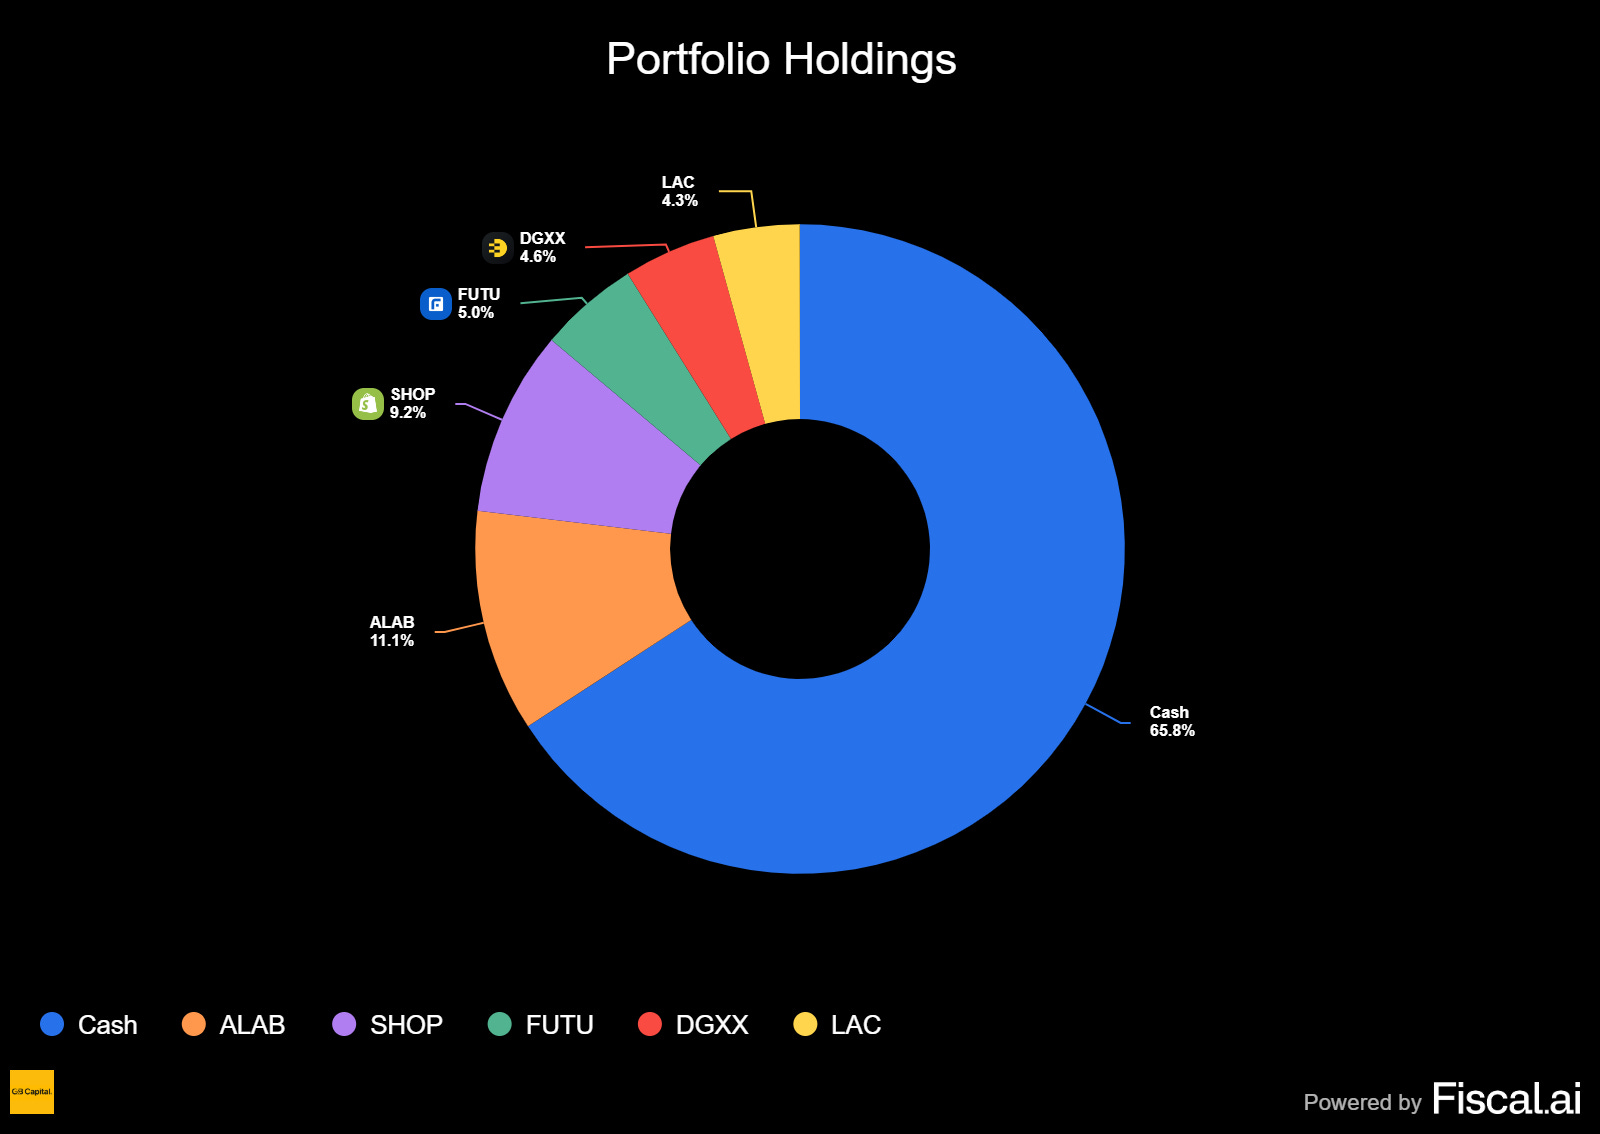
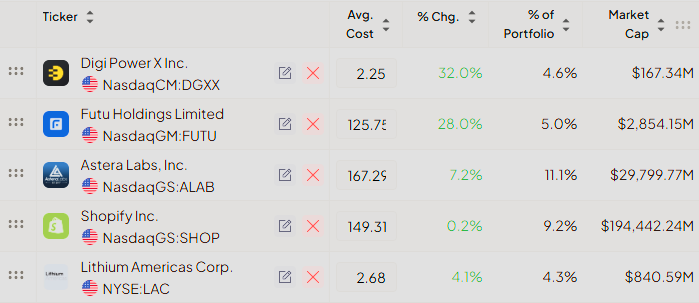
Portfolio updates and new positions:

⚡ AI-optimized, human-verified: Our expert team carefully selected Premium market intelligence from Fiscal.ai data. Explore now →
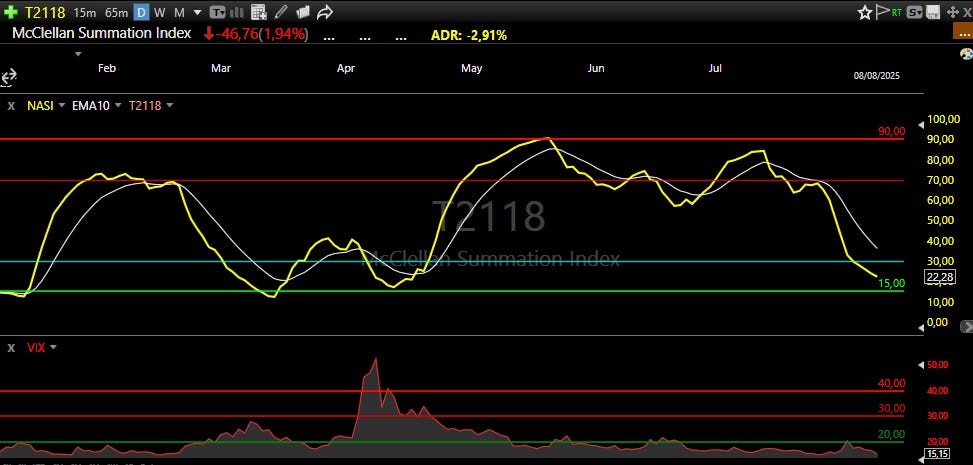
T2118
The market continues to flash warning signs, demanding a disciplined and highly selective approach. While major indexes may appear resilient, a deeper look at market internals reveals a concerning trend that reinforces our cautious stance.
The most telling indicator, the T2118, dropped again this week from 32.96 to a mere 22.28. This is a clear sign that market participation is exceptionally slim. A small number of mega-cap stocks are dragging the indexes higher, while the vast majority of stocks are not participating in the advance. This divergence is a significant signal that we must remain vigilant. On a positive note, the Volatility Index (VIX) is providing some sense of stability, settling comfortably under the 20.00 level at 15.15. This suggests that broad market anxiety has subsided for now, creating a more stable backdrop for individual stock performance.
Given this environment, we believe it's crucial to participate in the market, but to do so with surgical precision. This is not the time to be making broad bets on low-quality or speculative names. Our strategy is to be picky and identify opportunities in the best-in-class stocks. For this reason, we opened new positions in ALAB and SHOP, two high-quality companies that recently delivered stellar earnings reports.
However, the market also reminded us of the risks associated with speculation in this tape. Our position in AIP, a name we liked but was admittedly more speculative, was punished and resulted in a loss. We also initiated a position in LAC, another speculative name, but one with a significant catalyst in its Thacker Pass project. We believe the lithium theme will be highly relevant in the future and are willing to see if this one can work.
For real-time updates on our positioning, trade ideas, and market commentary as conditions evolve, our chat remains the best resource for staying connected with our analysis and decision-making process.
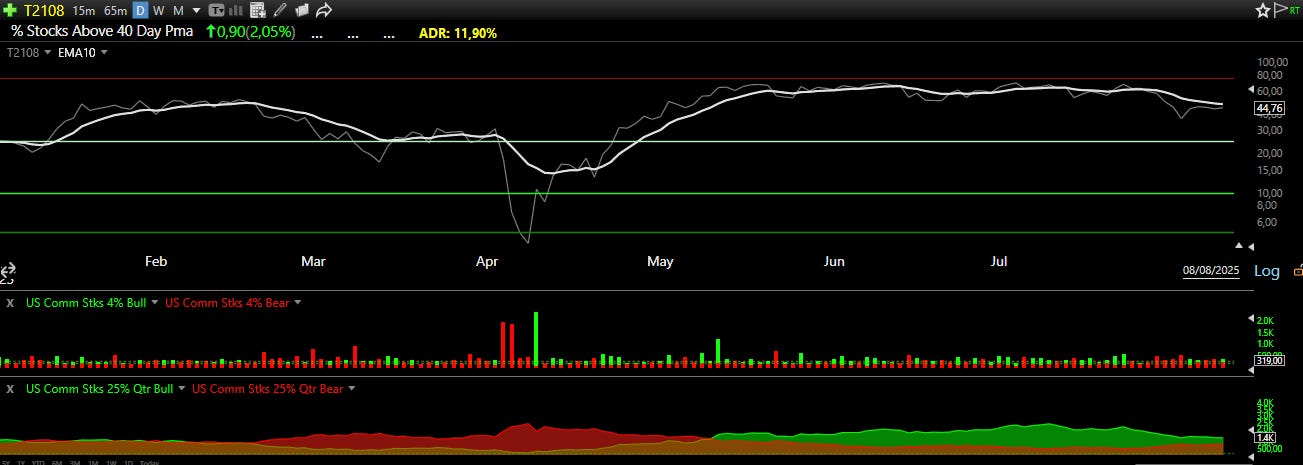
T2108
The T2108 indicator is giving us a reading of 44.76 and is currently stabilizing under its 10-day moving average, which is not a positive sign for the bulls. This confirms that the rally has been losing steam since the end of July. While the readings from the T2108 are somewhat lighter than what we've seen from other internal measures like the T2118, they still point to the same conclusion: the market's advance is becoming narrower and less supported.
The 4% Bull-Bear Indicator reinforces this view, showing another week of choppy, inconclusive action. This highlights a lack of a defined, short-term trend, as neither the bulls nor the bears have been able to take decisive control. This reflects the ongoing battle between the few stocks driving the indexes and the broader market that is failing to participate.
The 25% Bull-Bear Indicator is holding at nearly the same level as last week. While the bulls technically remain in control, their power has noticeably diminished compared to a couple of weeks ago. The indicator currently suggests a market in equilibrium, a standoff between bullish and bearish forces. This stabilization could be the calm before the next significant move, and we will be watching closely to see which side gains the upper hand in the weeks to come.
Latest articles:
🌱 Support Our Work: Buy Us a Coffee or Shop Our Services! 🌱
Your small gesture fuels our big dreams. Click below to make a difference today.
[☕ Buy Us a Coffee]
[🛒 Visit Our Shop]

Each stock on the watchlist will now have a risk grade badge next to its name, reflecting our assessment based on factors such as volatility, share float, technicals, fundamentals, ADR, and more. This badge is designed to help readers gauge the stock's risk profile, providing valuable context for making informed decisions about approaching it.
High risk: ⚠️
Medium Risk: 📊
Low Risk: 🛡️
🆓✨ Watchlist Essentials: Top Free Picks
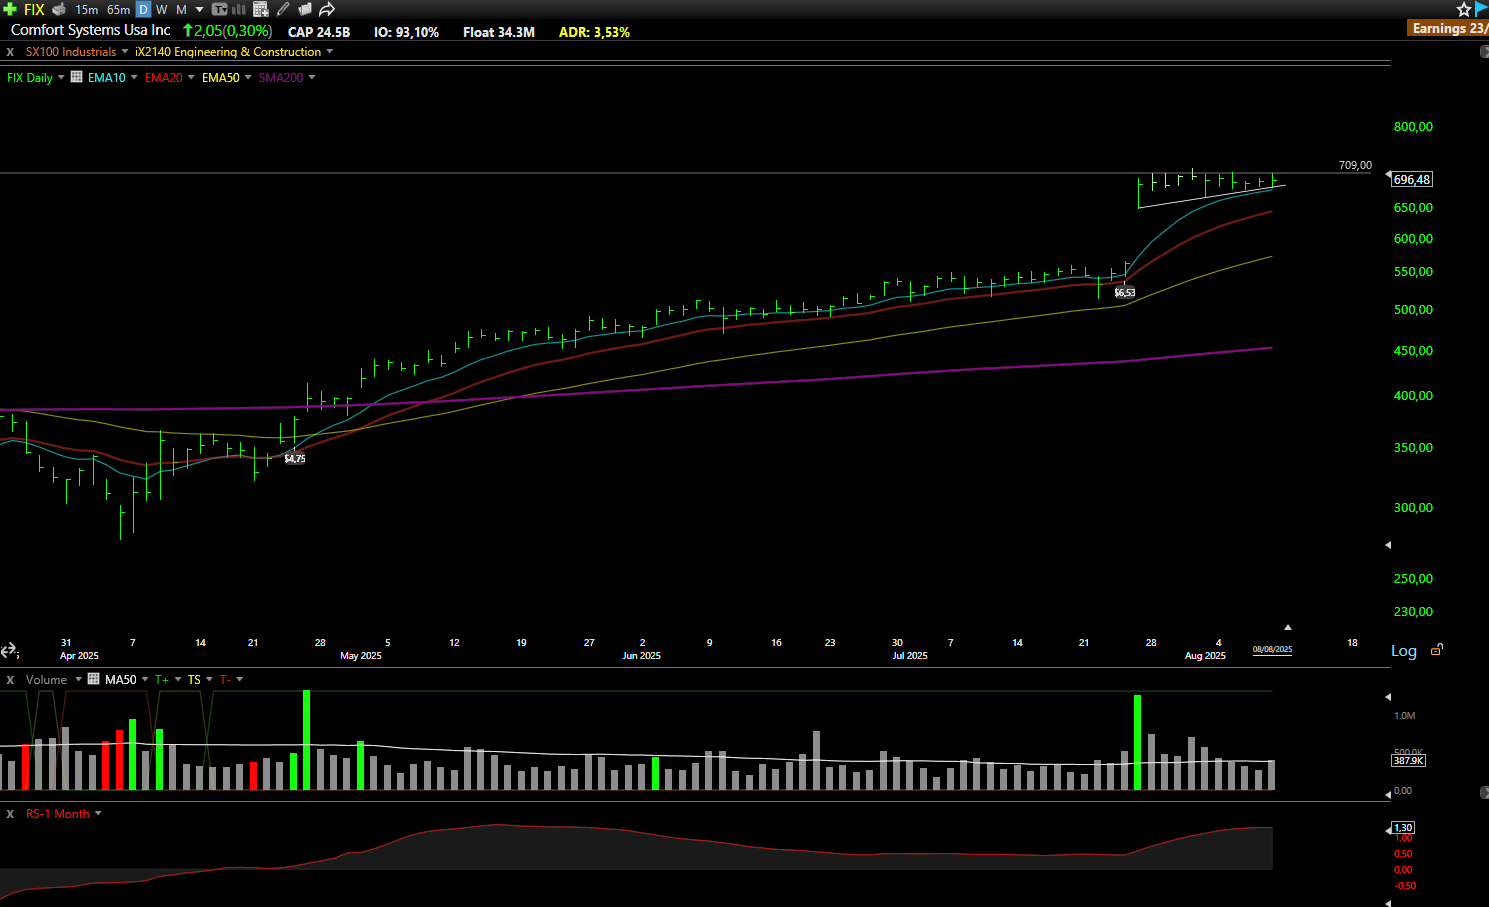
FIX: Comfort Systems USA, Inc. 🛡️
What they do: A national provider of comprehensive heating, ventilation, air conditioning (HVAC), and electrical contracting services.
Why watch? 🛠️ Following a strong earnings report at the end of July, the stock gapped up and is now digesting the move while holding above its 10-day EMA. A couple more days of sideways consolidation could improve the setup from good to ideal. The key level to watch for a breakout is $709.00.
MEDP: MedPace Holdings, Inc. 📊
What they do: A global, full-service clinical contract research organization (CRO) for the biotech and pharmaceutical industries.
Why watch? ⚕️ Similar to FIX, MEDP had a significant gap up on strong earnings. The stock has since pulled back on low volume and is consolidating over the 10-day EMA. With volume drying up nicely, the stock appears poised to reclaim the $436.00 level, which marks the low of the earnings gap-up day.
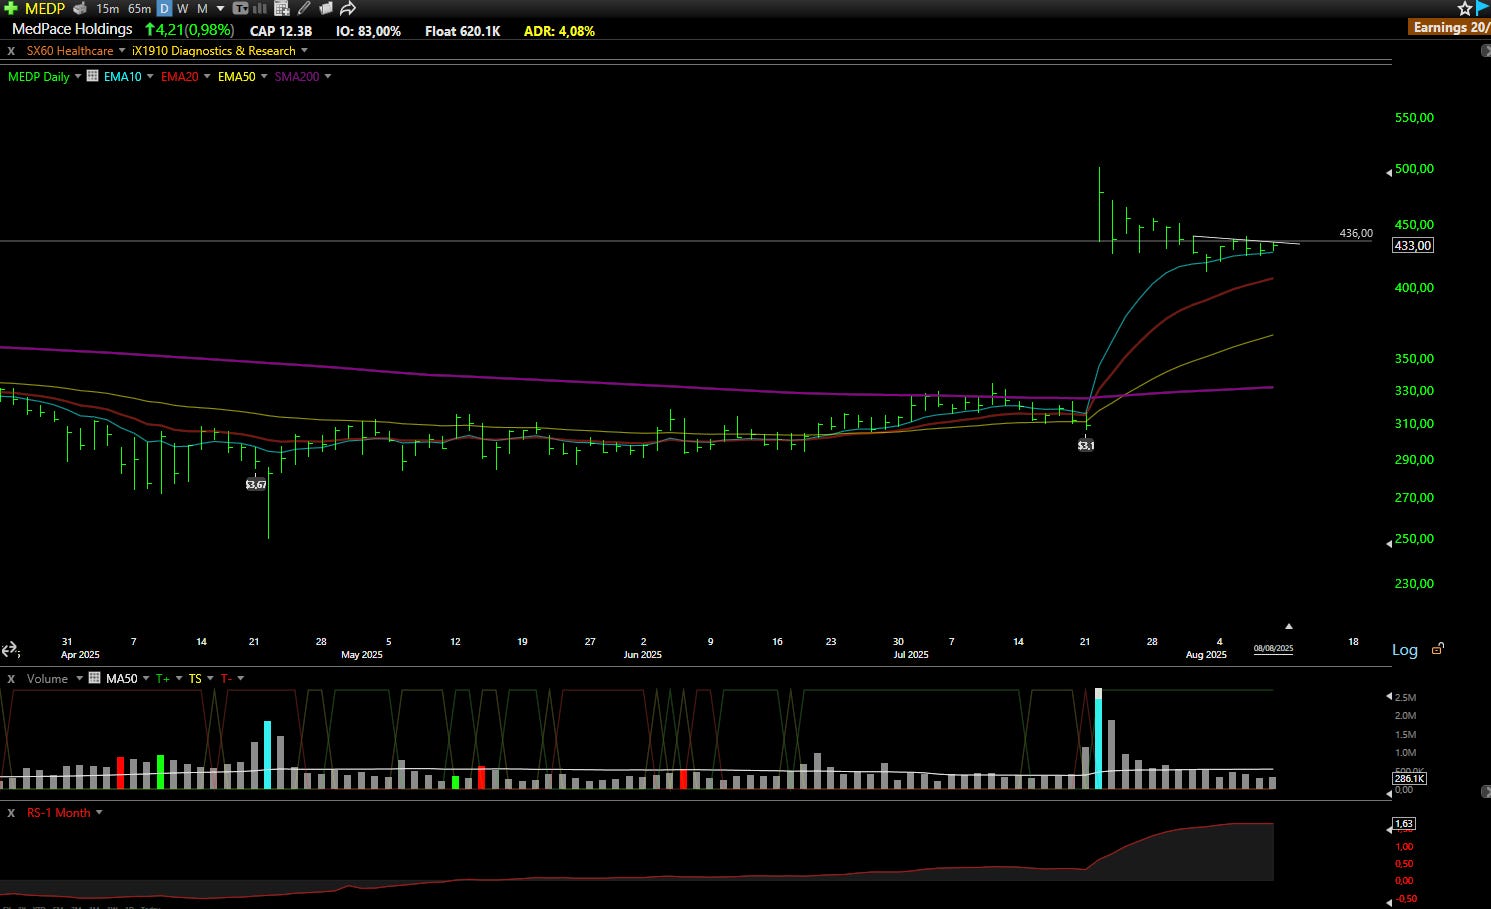
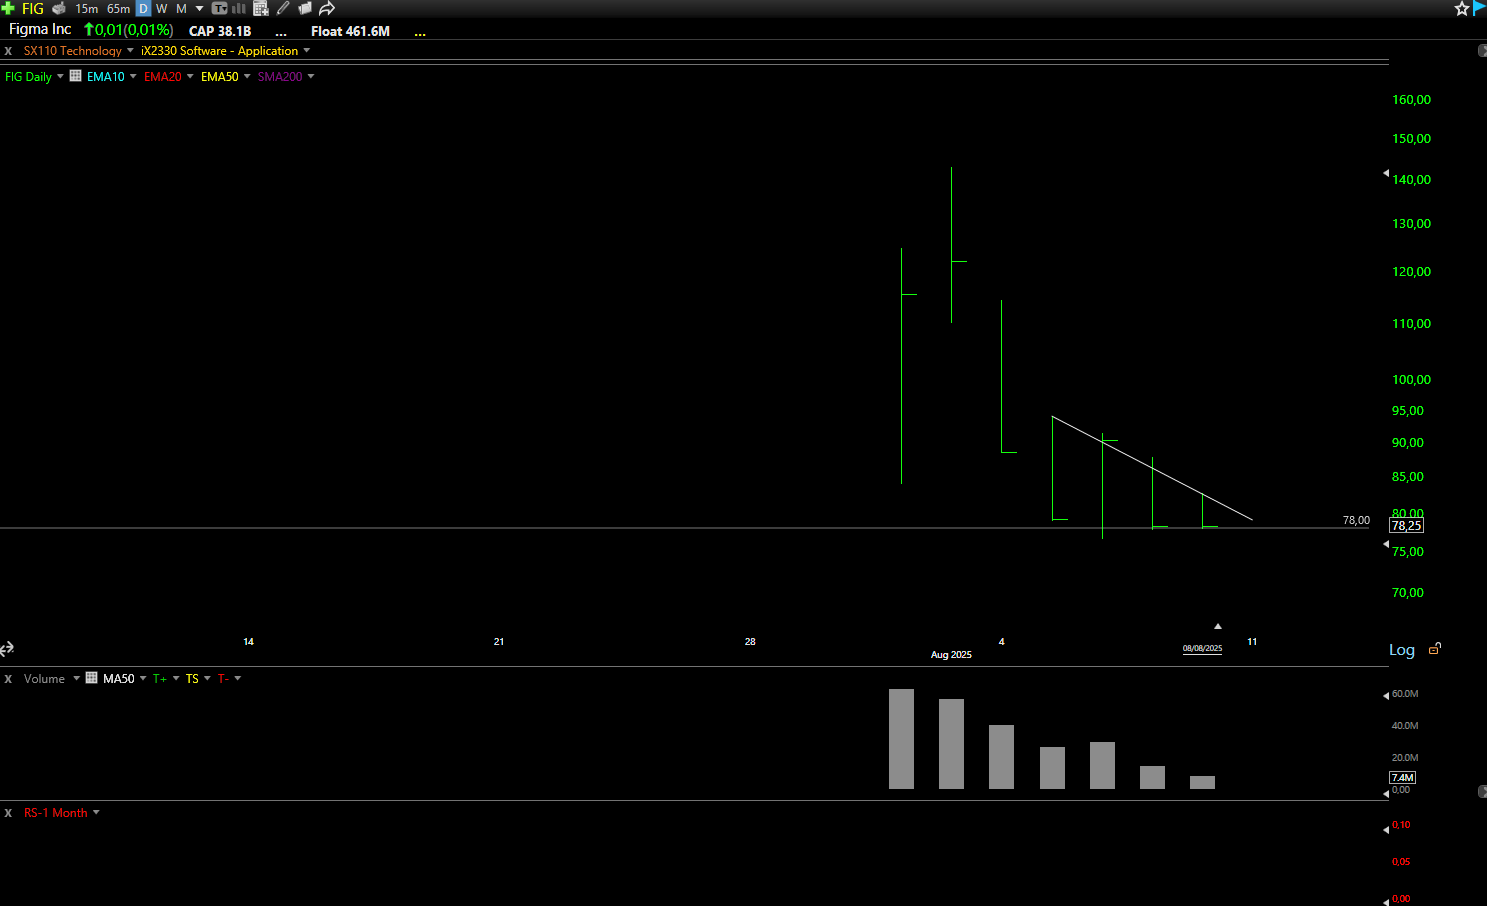
FIG: Figma Inc. ⚠️
What they do: A collaborative web application for interface design and prototyping.
Why watch? 🤖 This initial public offering (IPO) was a show to watch. The price shot up, giving the company an unreal valuation after just two days of trading, but the stock has now plunged almost 50% from its highs. The level on watch is $78.00, and the coming week will be crucial to understand if this can act as support. You could risk a couple of dollars to potentially make at least three times more on a bounce play, making it a risky but interesting bet.

Put the market on autopilot, experience the Best Platform with TC2000
Explore now →
💎📈 Watchlist Elite: Premium Market Movers
Each selection undergoes rigorous financial analysis, technical evaluation, and strategic assessment, delivering institutional-grade research.
