

🚀 Wall Street Radar: Stocks to Watch Next Week
💼 Volume 46: Oil up. Tech down. The market is speaking. Are you listening? 👂

Portfolio updates and new positions:


⚡ AI-optimized, human-verified: Our expert team carefully selected Premium market intelligence from Finchat's data. Explore now →
T2118
This week marked a significant deterioration in market breadth as the T2118 indicator plunged from 70.12 to 57.24, representing a substantial shift in underlying market dynamics. This sharp decline is particularly noteworthy given that the indicator reached all-time highs just one month ago. Since that peak, we've witnessed a consistent downward trajectory, providing us with a clear cautionary signal about the market's internal health.
The deteriorating breadth story is further reinforced by the VIX, which has once again climbed above the critical 20.00 threshold. As we've consistently emphasized, elevated VIX levels above this mark typically signal increased market uncertainty and suggest it's prudent to adopt a wait-and-see approach rather than aggressively pushing into new positions. The current environment is characterized by choppy price action with relatively few stocks gaining meaningful traction.
While we can't predict the market's ultimate direction with certainty, we've taken decisive action to protect our capital. This week, we closed our two remaining significant positions (LASR and ELF), both at profitable levels. Our portfolio is now streamlined to just DGXX, which we're holding with a stop at breakeven.
Our DGXX position has already been substantially de-risked, having sold two-thirds of our initial stake. This allows us to give the remaining position some breathing room while maintaining strict risk management. Should we identify another compelling setup with the same name, we remain open to adding back exposure.
Given the current market conditions and the lack of quality setups that align with our trading methodology, we're comfortable maintaining our predominantly cash position. The scarcity of high-probability opportunities continues to limit our active engagement, reinforcing our disciplined approach.
For real-time updates on our positioning, trade ideas, and market commentary as conditions evolve, our chat remains the best resource for staying connected with our analysis and decision-making process.

T2108
This week, the T2108 indicator remained relatively stable at 50.64, showing minimal movement from the previous week's levels. However, what's particularly noteworthy is its behavior relative to other market measures. Unlike the sharp deterioration we've seen in the T2118, the T2108 is moving more in tandem with the broader indices rather than following its breadth counterpart. This lack of alignment across our key indicators leaves us without a clear directional consensus, keeping us open to multiple market scenarios.
The divergence between T2108 and T2118 creates an uncertain technical landscape. We could be witnessing choppy consolidation before the next uptrend leg, or this could represent the early stages of broader market weakness where T2118's deterioration eventually pulls T2108 and the indices lower. Without clear alignment among our primary indicators, we simply don't have a definitive read on the market's next move.
Given this uncertainty, we've made the strategic decision to remain predominantly in cash until we gain better clarity on the market's direction.
The 4% Bull-Bear Indicator provided some insight into the week's character, revealing choppy price action with bears maintaining a slight edge in control. This short-term measure reflects the indecisive nature of current market dynamics, with neither bulls nor bears able to establish clear dominance.
The 25% Bull-Bear Indicator remains virtually unchanged from last week, suggesting stability in the medium-term outlook. Bulls retain control at this timeframe, though their influence has noticeably weakened compared to the strength we observed 1-2 months ago. This gradual erosion of bullish conviction, while not yet decisive, adds another layer to our cautious market assessment.

Latest articles:
🌱 Support Our Work: Buy Us a Coffee or Shop Our Services! 🌱
Your small gesture fuels our big dreams. Click below to make a difference today.
[☕ Buy Us a Coffee]
[🛒 Visit Our Shop]

Each stock on the watchlist will now have a risk grade badge next to its name, reflecting our assessment based on factors such as volatility, share float, technicals, fundamentals, ADR, and more. This badge is designed to help readers gauge the stock's risk profile, providing valuable context for making informed decisions about approaching it.
High risk: ⚠️
Medium Risk: 📊
Low Risk: 🛡️
🆓✨ Watchlist Essentials: Top Free Picks
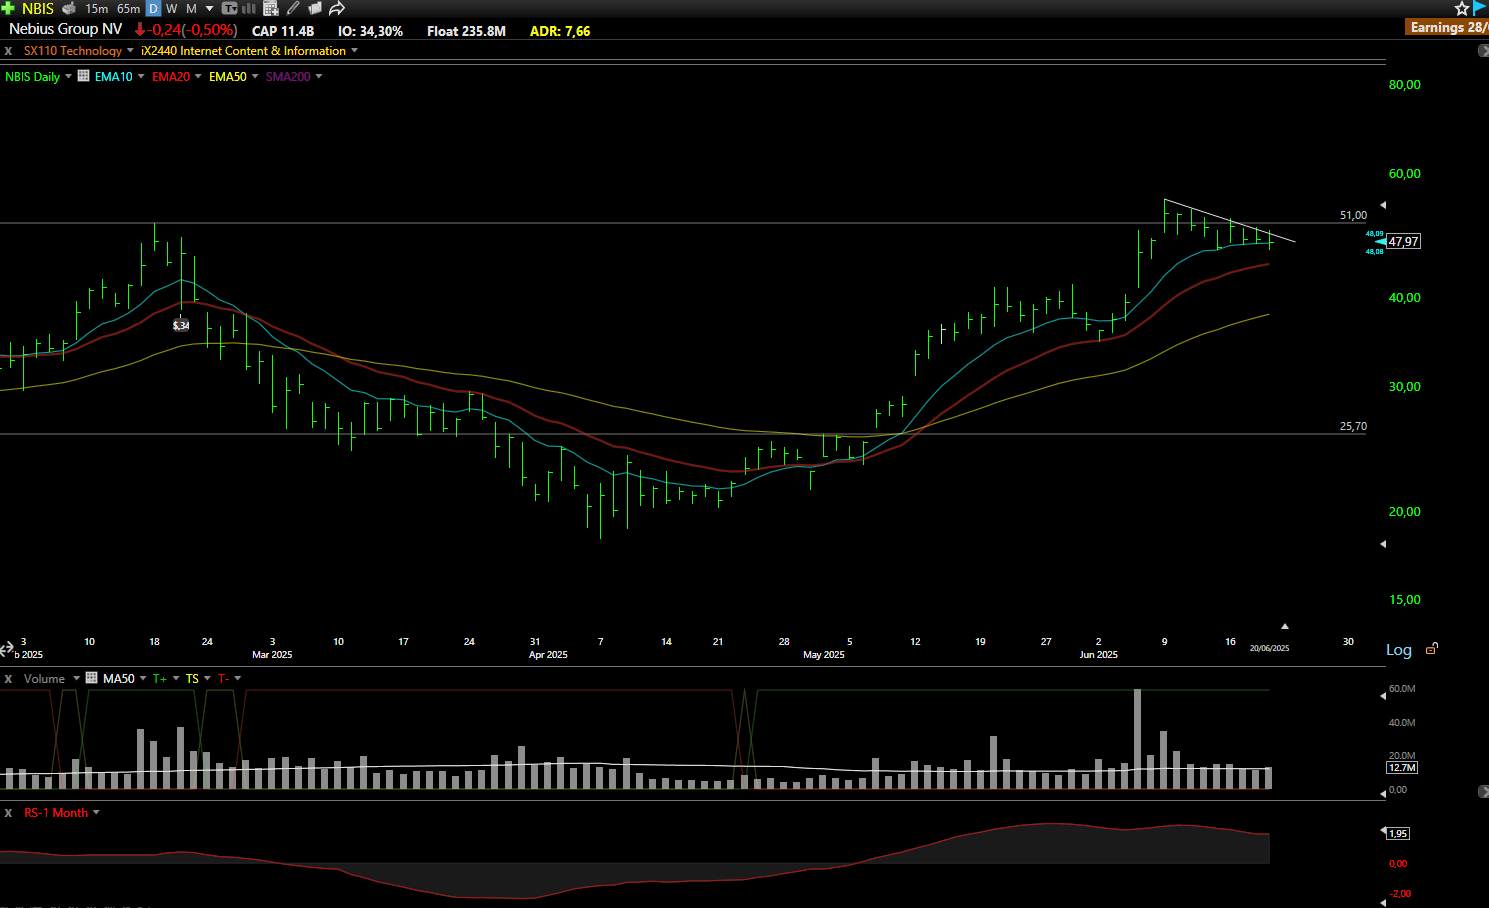
NBIS: Nebius Group NV ⚠️
What they do: AI infrastructure and cloud computing services provider
Why watch? 🤖 Trading just under the $51.00 all-time highs, NBIS is digesting its recent run while holding above the 10-day EMA. The stock showed relative strength on Friday, and institutional interest has notably increased over the past two months, a significant shift from its previous retail-only following. Further consolidation, allowing the 20-day EMA to catch up, would create an ideal technical setup.
NAKA: Nakamoto Holdings ⚠️
What they do: Cryptocurrency treasury and digital asset management company
Why watch? ₿ Crypto treasuries are on fire, and NAKA demonstrated remarkable relative strength on Friday, closing green while finding support twice at the rising 50-day EMA. The stock is forming a symmetric triangle pattern, extremely volatile and high-risk, but poised for an explosive move once the triangle resolves.

AGYS: Agilysis Inc 🛡️
What they do: Healthcare technology and analytics solutions provider
Why watch? 📈 After crushing analyst expectations in late May with a 30% monthly surge, AGYS is consolidating on low volume near the 10-day EMA while the 20-day EMA catches up, forming a cup-and-handle pattern. A breakout above $110.00 with volume would signal the next leg higher.

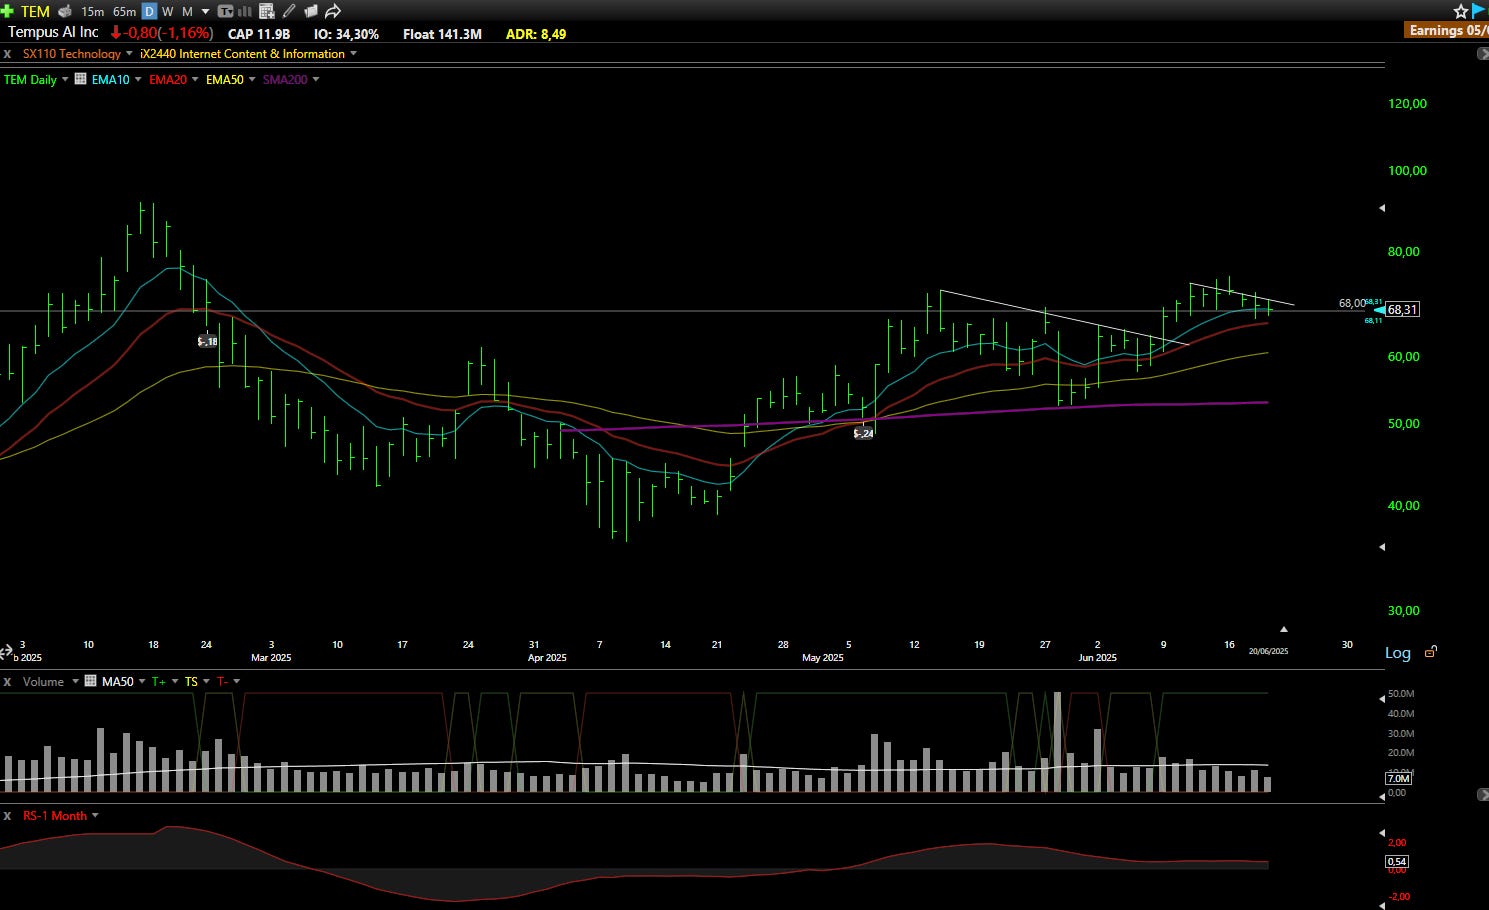
TEM: Tempus AI Inc ⚠️
What they do: AI-enabled precision medicine and diagnostics platform
Why watch? 🧬 Made a powerful 39% move after dismissing a short report, proving market confidence in the company. Now pulling back on low volume to the 10-day EMA. A break above the $71.00-$72.00 resistance zone with volume would clear recent overhead resistance and trigger the next upward move.

Put the market on autopilot, experience the Best Platform with TC2000
Explore now →
💎📈 Watchlist Elite: Premium Market Movers
Each selection undergoes rigorous financial analysis, technical evaluation, and strategic assessment, delivering institutional-grade research.
Every week, we showcase one complete premium analysis at no cost, letting you experience firsthand the depth and quality that sets Elite research apart.
SAIL: SailPoint Inc 📊
What they do: AI-powered enterprise identity security solutions featuring lifecycle management and compliance
Why watch? 🔐 SailPoint's modular Identity Cube platform is uniquely positioned to capture the $55 billion addressable market as identity security becomes increasingly complex with AI and cloud advancements. The platform offers comprehensive enterprise identity management with strong expansion potential in machine identities and AI agent markets. Q1 FY26 results delivered impressive 23% revenue growth and 30% ARR growth, beating expectations with significant growth in large deals. The company is positioned for sustained 20% annual revenue growth through fiscal year 2028. The critical $22.00 support level (earnings gap-up low) must hold, with a break above $23.00 on volume needed to trigger the next leg higher.

