🚀 Wall Street Radar: Stocks to Watch Next Week
💼 Volume 44: S&P 500 breaks 6K milestone - riding the momentum wave

Portfolio updates and new positions:

⚡ AI-optimized, human-verified: Our expert team carefully selected Premium market intelligence from Finchat's data. Explore now →
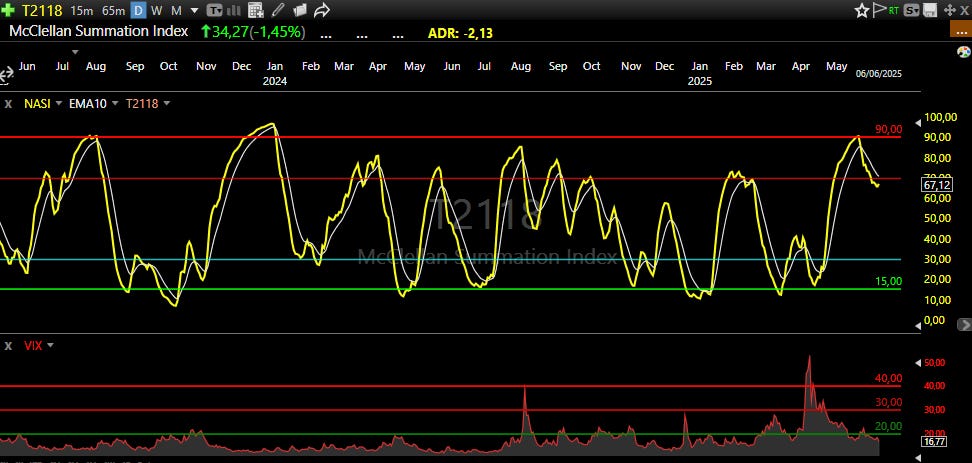
T2118
This week brought another subtle shift in the T2118 indicator, with values declining modestly while remaining close to last week's levels. This development warrants careful consideration, as it presents two distinct market scenarios that could unfold in the coming sessions.
The first interpretation suggests we may be witnessing a concerning divergence pattern. When the T2118 remains relatively stagnant despite index advances, it often indicates that only a select group of stocks or sectors are driving the broader market higher. This narrow participation typically signals that a pullback could be on the horizon, as the rally lacks the broad-based support needed for sustained momentum.
Alternatively, this week's limited participation could simply represent the natural ebb and flow of sector rotation. If this proves to be the case, we may see capital flowing into previously lagging sectors in the weeks ahead, creating a more balanced and sustainable uptrend environment. Supporting this more optimistic view is the VIX's stabilization below the critical 20.00 level—a technical condition that historically favors low-volume, low-volatility bullish trends.
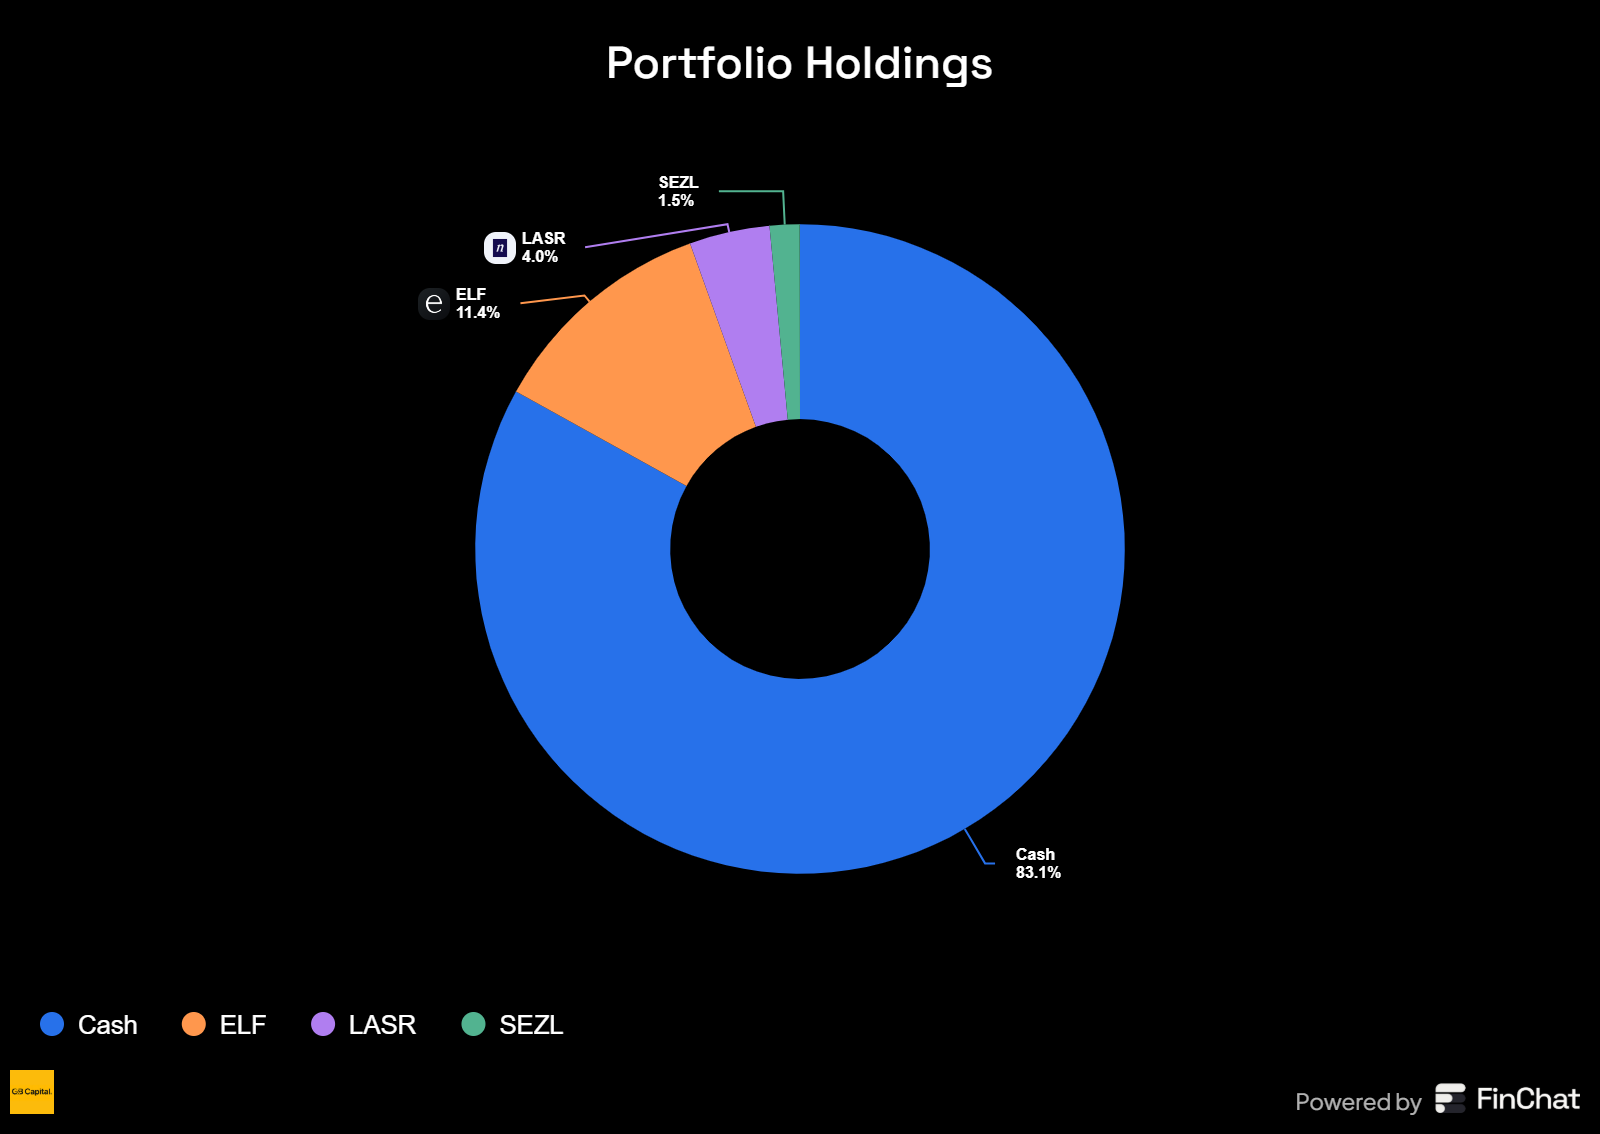
From a portfolio management perspective, this week proved particularly challenging for our trading operations. Quality setups were scarce, and the few positions we did initiate failed to meet our performance expectations. This difficult environment prompted us to take a step back and reassess our approach with a more critical eye.
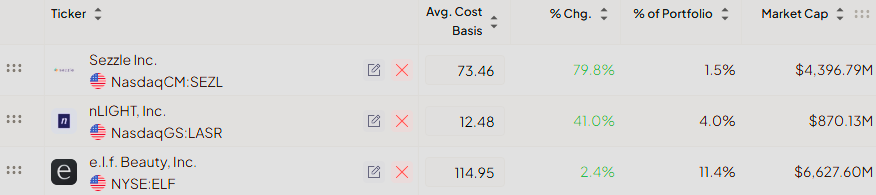
In response to these suboptimal results, we made the strategic decision to close the majority of our positions, locking in available profits while resetting our portfolio for better opportunities ahead. Our streamlined portfolio now consists of three carefully selected positions. We're holding ELF with a stop-loss set at breakeven, providing downside protection while allowing for potential upside participation. Additionally, we're monitoring SEZL and LASR as they track along their respective 10-day exponential moving average.
For the most immediate access to these kinds of commentaries, real-time trade ideas, and daily watchlists, the best place to be is our chat. If you're looking to stay ahead with daily insights and analysis, consider joining our community!
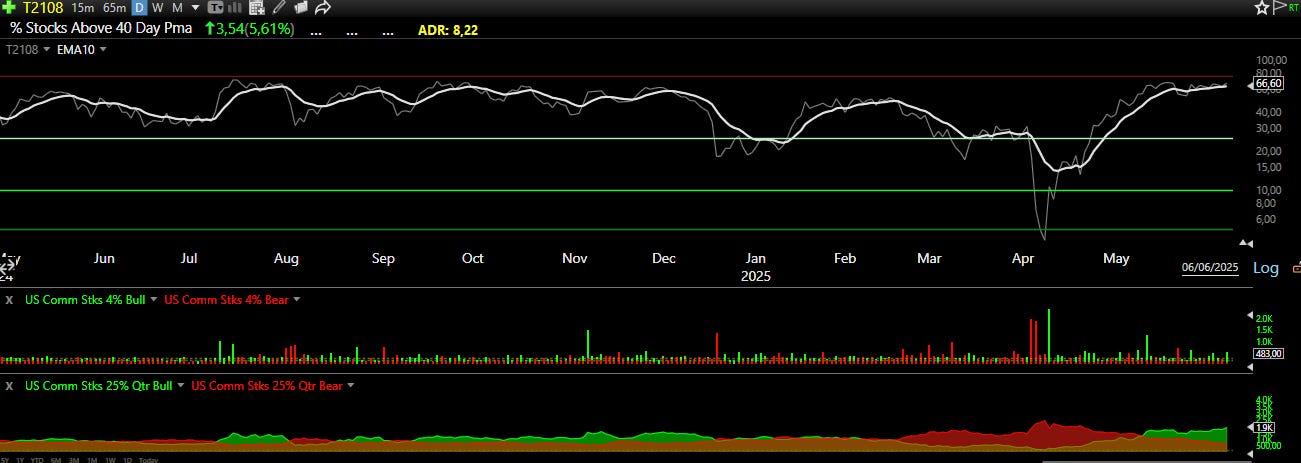
T2108
The T2108 indicator this week shows minimal movement, holding at a notably elevated 66.60 level while maintaining its consolidation phase above the 10-day exponential moving average (10ema). This high reading, combined with the continued sideways action, mirrors the behavior we're seeing across broader market indices. The key question remains: Will this consolidation pattern resolve in a breakout similar to a Volatility Contraction Pattern (VCP), propelling prices higher, or will we see a breakdown below the 10ema support level? As markets often do, they have a tendency to confound the majority by moving in the direction least expected.
The 4% Bull-Bear Indicator delivered a decisively bullish week, with bulls maintaining dominance on nearly every trading session. This consistent bullish control throughout the week has significantly strengthened the short-term market environment, placing the advantage firmly in the hands of the bulls.
The 25% Bull-Bear Indicator continues its positive trajectory this week, with improving readings that reinforce the longer-term bullish outlook. All indicators are aligning to suggest that the underlying long-term trend remains solidly bullish, providing a supportive backdrop for continued upward momentum in the weeks ahead.
Latest articles:
🌱 Support Our Work: Buy Us a Coffee or Shop Our Services! 🌱
Your small gesture fuels our big dreams. Click below to make a difference today.
[☕ Buy Us a Coffee]
[🛒 Visit Our Shop]

Each stock on the watchlist will now have a risk grade badge next to its name, reflecting our assessment based on factors such as volatility, share float, technicals, fundamentals, ADR, and more. This badge is designed to help readers gauge the stock's risk profile, providing valuable context for making informed decisions about approaching it.
High risk: ⚠️
Medium Risk: 📊
Low Risk: 🛡️
🆓✨ Watchlist Essentials: Top Free Picks
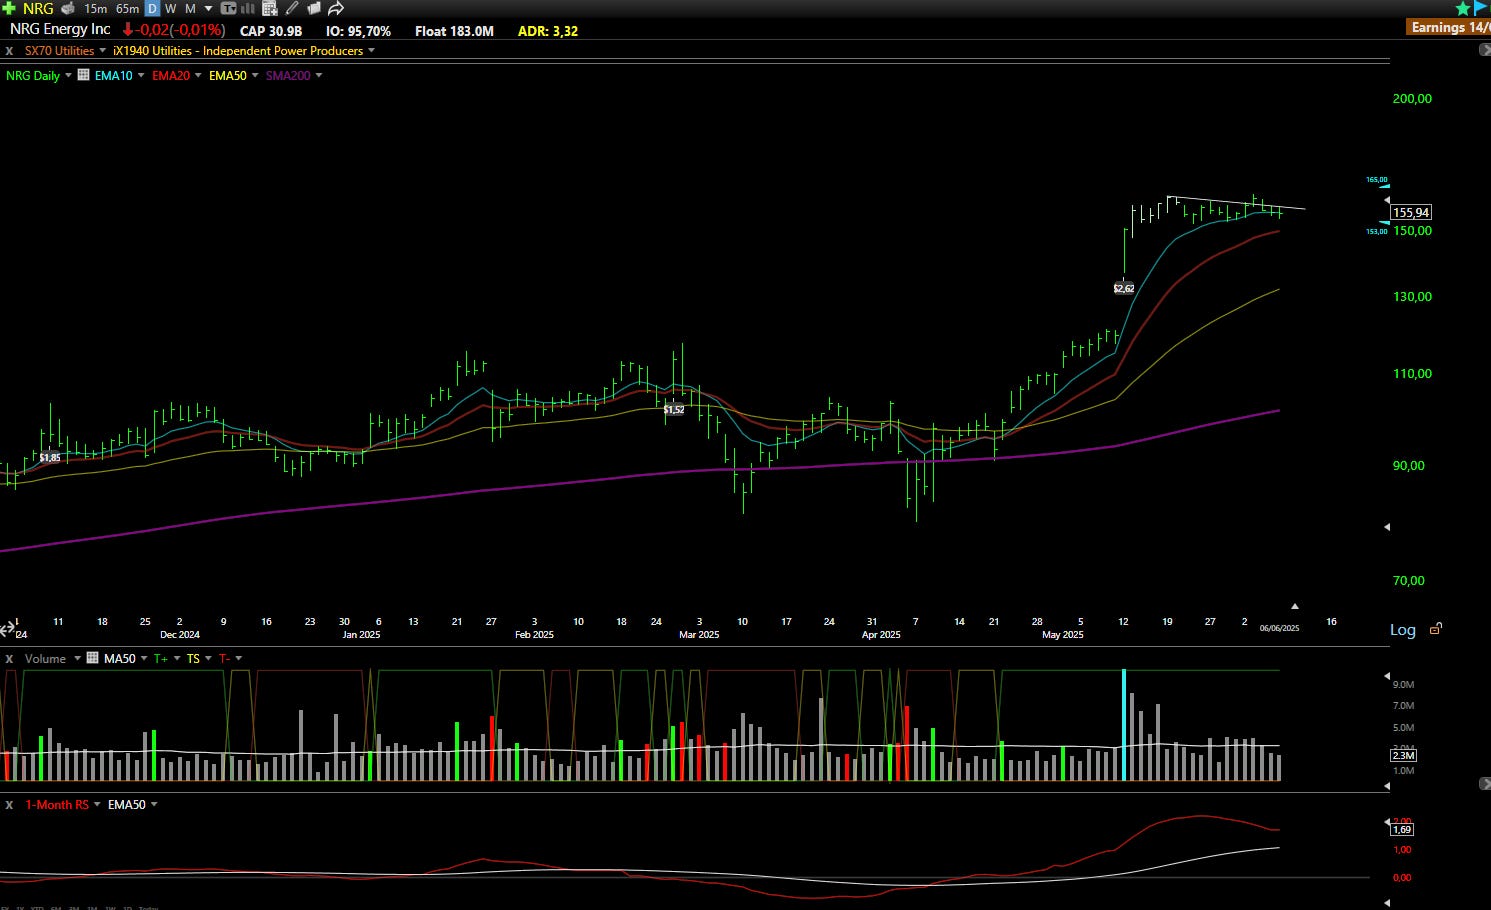
NRG: NRG Energy, Inc 🛡️
What they do: A power company involved in energy generation and retail electricity
Why watch? 🔋 Following an impressive earnings report in mid-May, NRG Energy has been consolidating its gains. The stock has been holding steady above its 10-day exponential moving average, which is now converging with the 20-day EMA. This technical action suggests a period of accumulation. The $151.00-$153.00 zone is a key support level that must hold for the stock to build a base for a potential break higher, as the market continues to price in the escalating energy demands from AI-driven data centers.

Put the market on autopilot, experience the Best Platform with TC2000
Explore now →
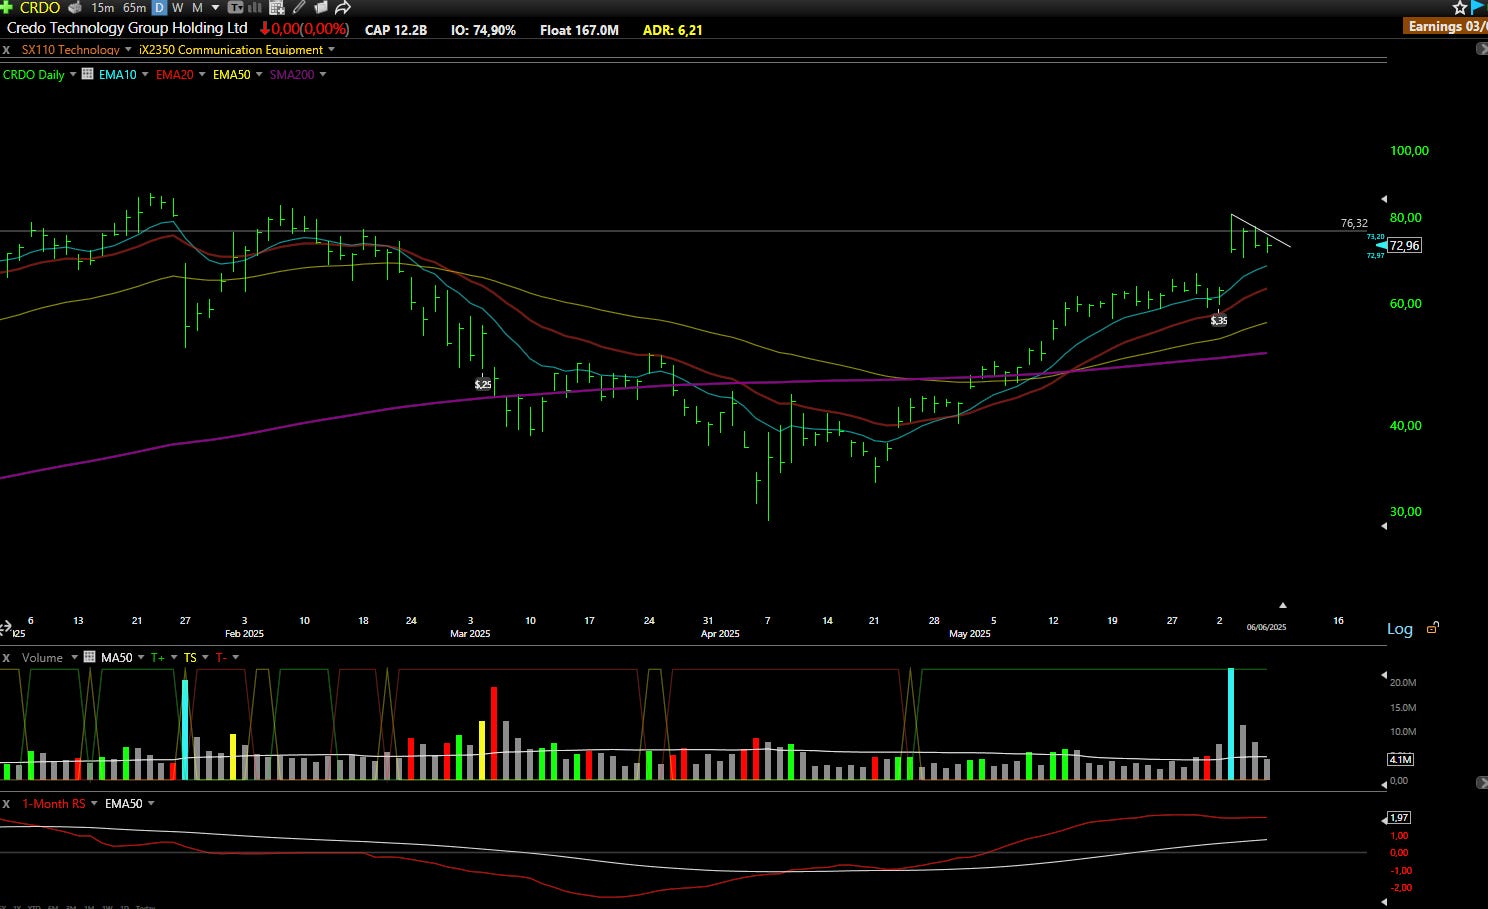
CRDO: Credo Technology Group Inc 📊
What they do: High-speed connectivity solutions for the data infrastructure market
Why watch? 🔌 After an explosive 100% run-up into its earnings announcement, it was natural to see some profit-taking and a subsequent selloff. The stock has now pulled back to the $71.00 level, which marks the low of the post-earnings gap-up—a technically significant support area. A decisive, high-volume move back above $75.00 could provide the necessary fuel for the next leg higher, signaling that the consolidation phase is complete.
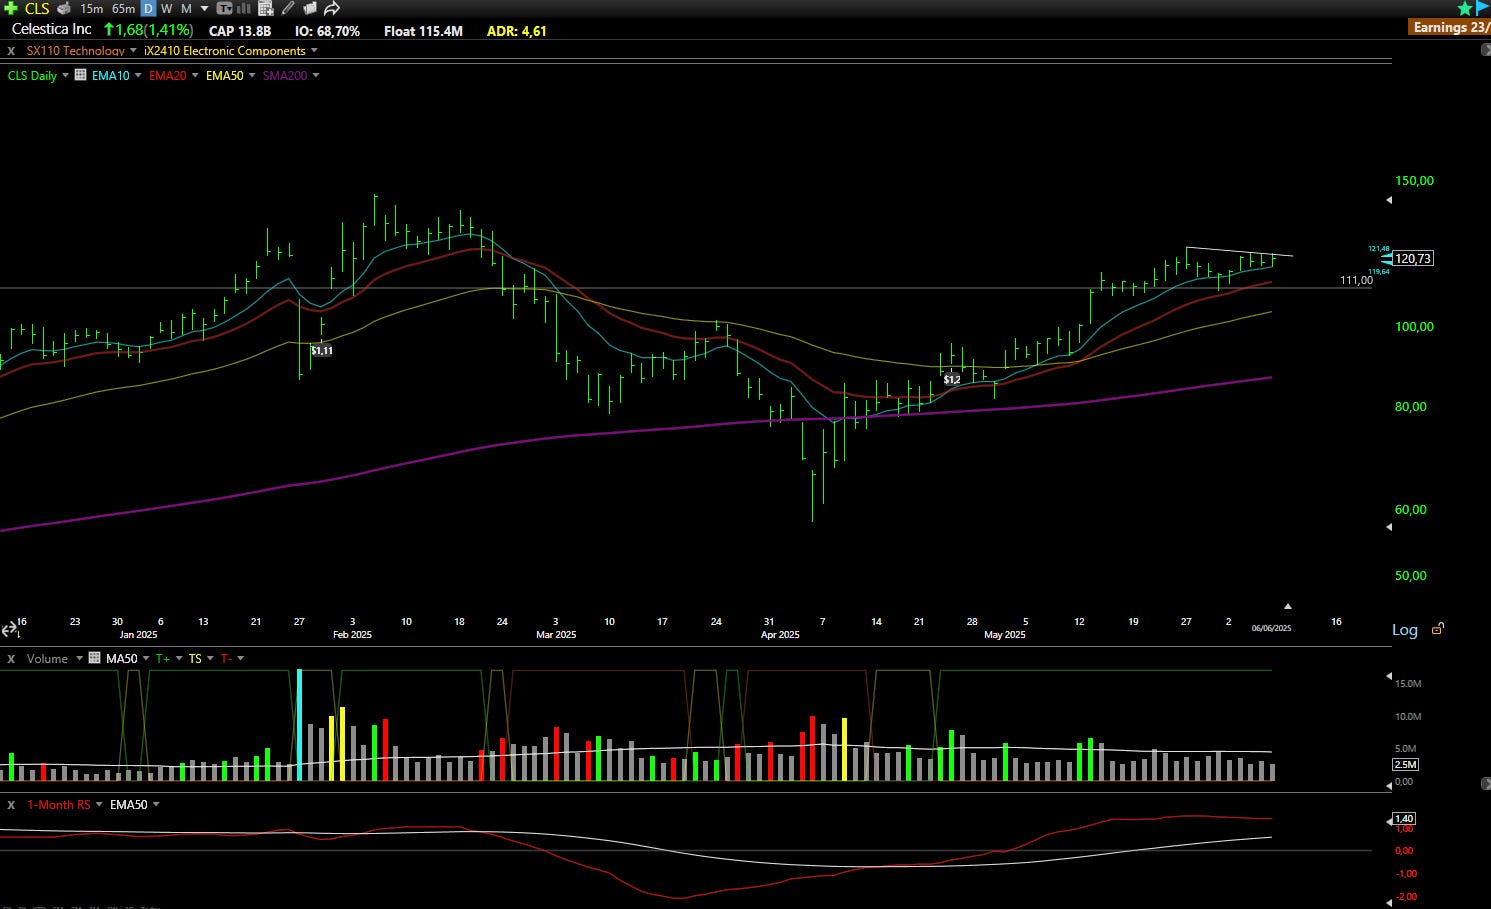
CLS: Celestica Inc 📊
What they do: Multinational electronics manufacturing services (EMS) company.
Why watch? ⚙️ Since April, Celestica's stock has been skillfully navigating its uptrend, using the 10-day exponential moving average as a dynamic support level. After breaking through the key $111.00 level and successfully retesting it, the shares have entered a three-week consolidation pattern on lower-than-average volume. This "quiet" period suggests a healthy pause. A breakout above the$122.00 mark would be a strong technical signal that the stock is ready to commence its next upward move.
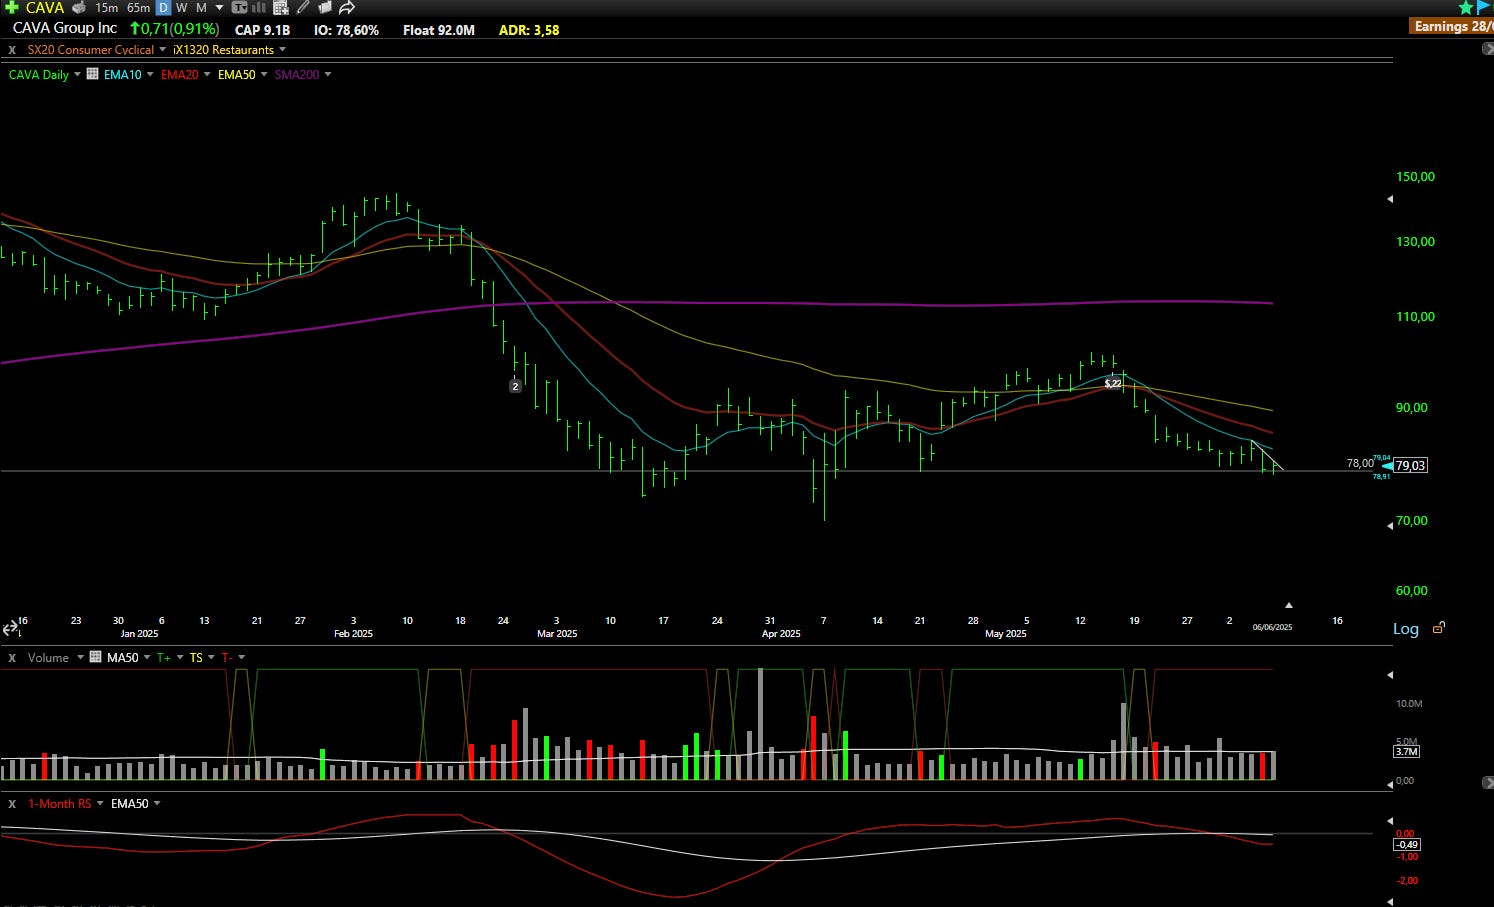
CAVA: Cava Group, Inc 📊
What they do: A fast-casual Mediterranean restaurant chain
Why watch? 🥙 After a premature entry attempt last week, CAVA is offering another potential opportunity. The stock successfully recaptured the critical $78.00 support level on Friday. This level is highly significant on the weekly chart, and holding it could provide a foundation for at least a short-term bounce. If the $78.00 level fails to hold, a deeper pullback toward the $70.00-$72.00 area, a key zone on the monthly chart, could be the next logical support.
💎📈 Watchlist Elite: Premium Market Movers
Each selection undergoes rigorous financial analysis, technical evaluation, and strategic assessment, delivering institutional-grade research.
Every week, we showcase one complete premium analysis at no cost, letting you experience firsthand the depth and quality that sets Elite research apart.
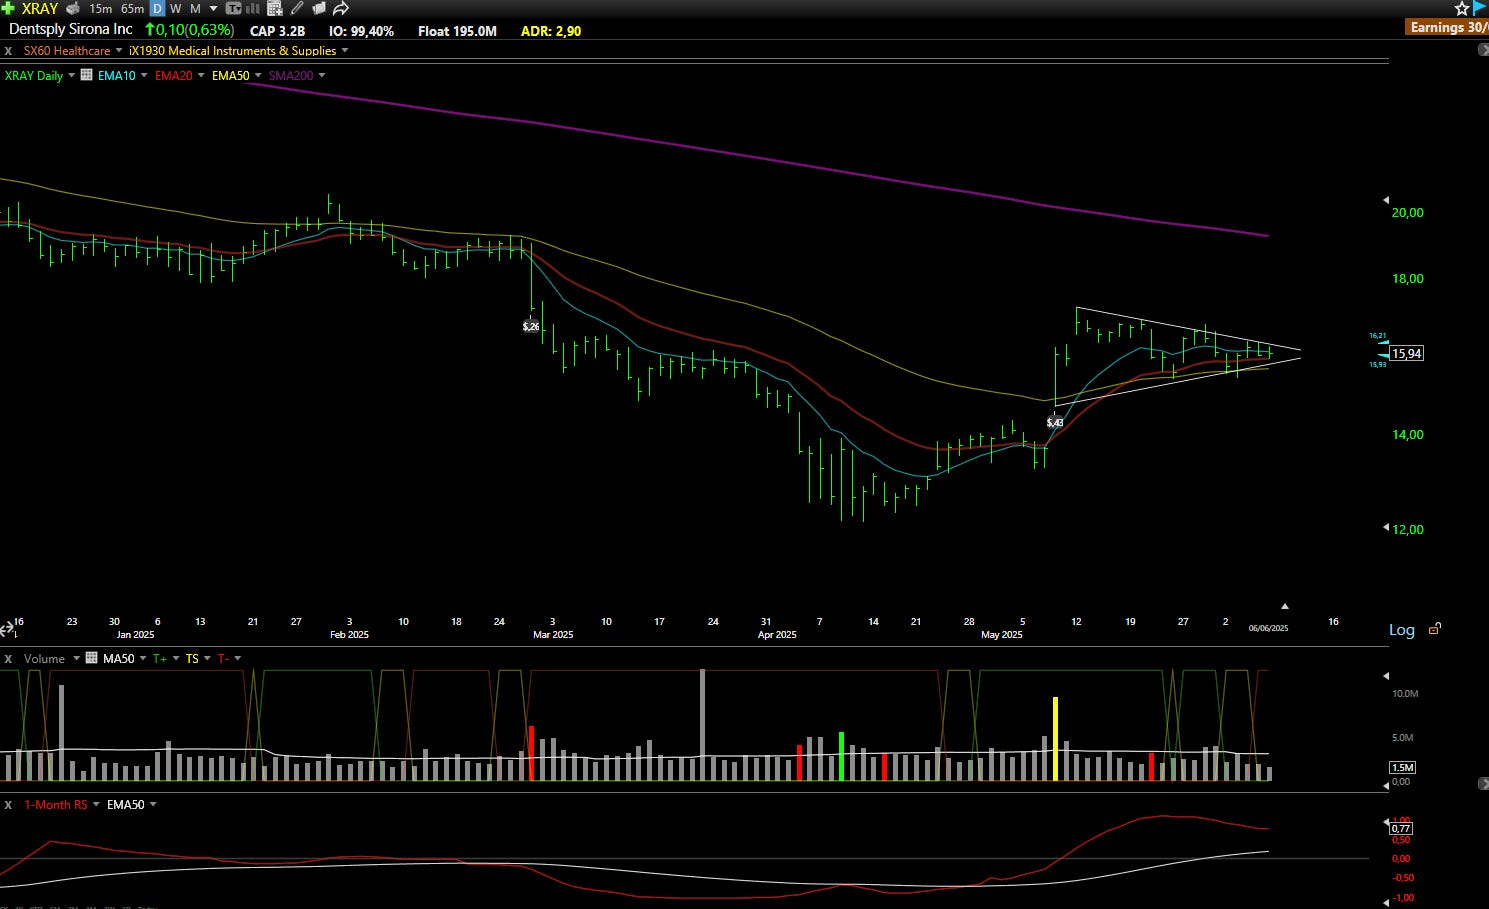
XRAY: Dentsply Sirona Inc 🛡️
What they do: American dental equipment manufacturer and dental consumables producer
Why watch?🦷Despite some sluggish recent financial results, Dentsply Sirona's balance sheet remains solid, featuring ample cash and a sustainable dividend, which reduces downside risk. With major headwinds likely subsiding and the long-term tailwind of an aging population, the stock presents a compelling speculative buy. From a valuation perspective, shares appear inexpensive, trading at approximately 0.9 times sales. Technically, the stock has reclaimed its key moving averages and is forming a constructive VCP (Volatility Contraction Pattern) since its last earnings report in May. A move towards the 200-day moving average, near the $20.00 level, could be an initial target.