

🚀 Wall Street Radar: Stocks to Watch Next Week
💼 Volume 39: 📈 Nine Days of Gains: Rally Leaders to Keep on Your Radar

Portfolio updates and new positions:


⚡ AI-optimized, human-verified: Our expert team carefully selected Premium market intelligence from Finchat's data. Explore now →
T2118
This week, the T2118 market breadth indicator closed at 77.14, a level not seen since February, when the market was approaching all-time highs. Such a high reading signals a significant overextension in the market, and history suggests that patience is crucial in these conditions. Rather than adding risk to your portfolio at this stage, waiting for a healthy pullback is wise, which can reset the market and provide better entry points.
Looking ahead, the key factor to watch during any pullback is sector rotation. If we see money moving between sectors rather than a broad-based selloff, it will be a strong sign that the market remains healthy beneath the surface. Until then, the only trades worth considering are those driven by specific news events or standout earnings reports, with clear and compelling catalysts.
Meanwhile, the VIX volatility index is cooling off but remains above 20. While this is an improvement, it’s still not ideal for a sustained, low-volatility uptrend. A further decline in the VIX would help create the stable environment needed for the market to build on its gains.

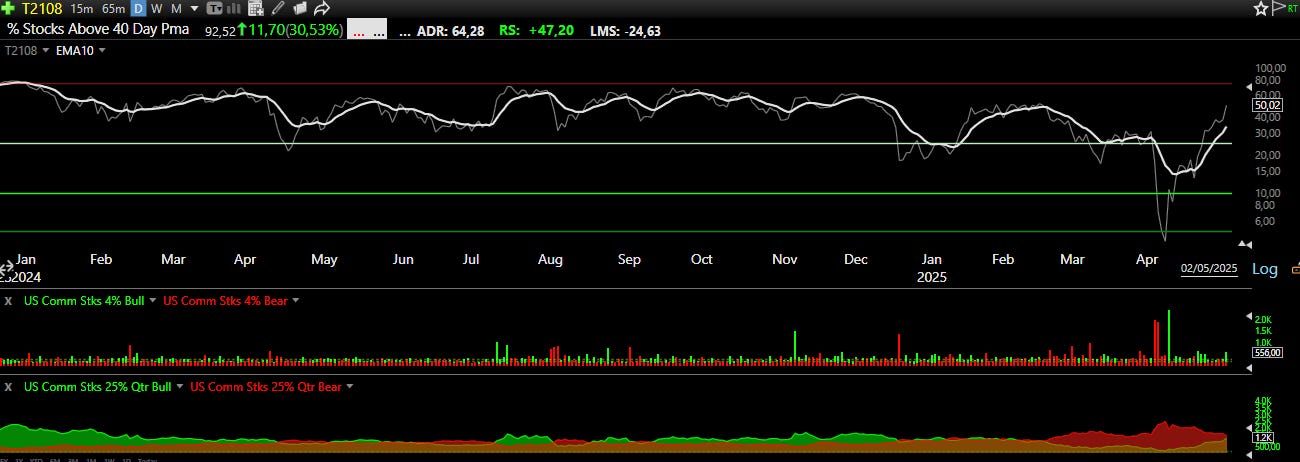
T2108
This week, the T2108 market breadth indicator closed at 50.02, closely tracking the movement of the T2118. While both indicators are moving in tandem, T2108 presents a different nuance: it’s not overextended, but rather sitting in a healthy medium range. Typically, T2108 is considered overextended above 80.00, so the current level suggests the market still has some “gas in the tank” before a significant pullback becomes likely.
However, this is not the time to let FOMO drive decisions.
The 4% Bull-Bear Indicator reflected a tug-of-war between bulls and bears this week, with only select sectors pushing the indexes higher. Notably, Friday saw a strong surge for the bulls, hinting at underlying strength but also highlighting that leadership is still somewhat narrow.
The 25% Bull-Bear Indicator is signaling that the bears are close to losing their grip, with bulls on the verge of regaining long-term control. If the market does experience a pullback—and especially if it comes on low volume—bulls could be poised to take clear leadership going forward.
Latest articles:
🌱 Support Our Work: Buy Us a Coffee or Shop Our Services! 🌱
Your small gesture fuels our big dreams. Click below to make a difference today.
[☕ Buy Us a Coffee]
[🛒 Visit Our Shop]

Each stock on the watchlist will now have a risk grade badge next to its name, reflecting our assessment based on factors such as volatility, share float, technicals, fundamentals, ADR, and more. This badge is designed to help readers gauge the stock's risk profile, providing valuable context for making informed decisions about approaching it.
High risk: ⚠️
Medium Risk: 📊
Low Risk: 🛡️
🆓✨ Watchlist Essentials: Top Free Picks
UNH: UnitedHealth Group Inc 🛡️
What they do: Health insurance and managed care.
Why watch? 🏥UnitedHealth's stock tanked following the Q1 earnings report after the company revised its earnings guidance for this year. Upon closer evaluation, the challenges faced by the company are likely to be short-lived, though UNH is now forced to deal with higher costs. Technically, the stock is forming a very sharp falling wedge—usually, this pattern does not resolve in a V-shape bounce, but a rebound from this level is likely. Just $20 below the current price sits a major monthly support level from 2022, providing another layer of safety and a potential spot for a bounce. This setup could offer a compelling risk/reward for traders watching for a reversal.


Put the market on autopilot, experience the Best Platform with TC2000
Explore now →
PM: Philip Morris International 🛡️
What they do: Global tobacco and nicotine products
Why watch? 🚬 Recent good earnings sparked a gap up after a big run that started at the beginning of 2025. The stock seems strong, and the $172 level is the key for another leg higher. PM has been consolidating since the earnings day—watch for a breakout above $172 to trigger a new uptrend.

TSLA: Tesla Inc 📊
What they do: Electric vehicles, energy storage, and solar.
Why watch? 🚗 TSLA is on the list for two reasons: there are no issues with earnings since they have already been announced, and the stock is one of the most hated and shorted on Wall Street. Even a very bad quarterly report didn't help the bears plunge the stock, which is a key signal. Typically, the most hated and shorted stocks have the potential to move significantly in the opposite direction. $293.00 is the key level on both the daily and weekly charts—a break of this level could fuel a big move.

DELL: Dell Technologies 📊
What they do: Technology solutions, hardware, and services.
Why watch? 💻After a period of big gaps in the indexes, it is really difficult to find low-risk entries. Dell is one of the few names in the tech space that hasn't already made a big move. Hopefully, we can see a last shakeout on the rising 10 and 20 EMA before breaking out over $95.50, the actual daily key level on watch.

💎📈 Watchlist Elite: Premium Market Movers
Each selection undergoes rigorous financial analysis, technical evaluation, and strategic assessment, delivering institutional-grade research.
Every week, we showcase one complete premium analysis at no cost, letting you experience firsthand the depth and quality that sets Elite research apart.
DHI: D.R. Horton Inc 🛡️
What they do: Homebuilding and residential construction
Why watch? 🏠D.R. Horton's revenues and margins are declining, but the impact on EPS is being mitigated by an increase in buybacks. The strong balance sheet with a 1.1x debt-to-net income ratio allows the company to issue debt at a 4+% rate and buy back stocks at a 9% yield. The housing market slowdown is affecting all the major homebuilders, but D.R. Horton's pricing strategy might help to navigate the situation. DHI has a rock-solid balance sheet and is taking advantage of the situation to boost its buybacks, and the stock price has declined by 37% in recent months. The stock is holding strong at the $124.00 key daily level, supported by the 10 and 20 EMA. The real challenge is to overcome the 50 EMA at $128.00–$130.00. Ideally, we’ll see a bit more sideways action before the next move.

