

🚀 Wall Street Radar: Stocks to Watch Next Week
💼 Volume 35: 💣 Tariff Tremors: Navigating the Multi-Trillion Market Meltdown

Portfolio updates and new positions:


⚡ AI-optimized, human-verified: Our expert team carefully selected Premium market intelligence from Finchat's data. Explore now →
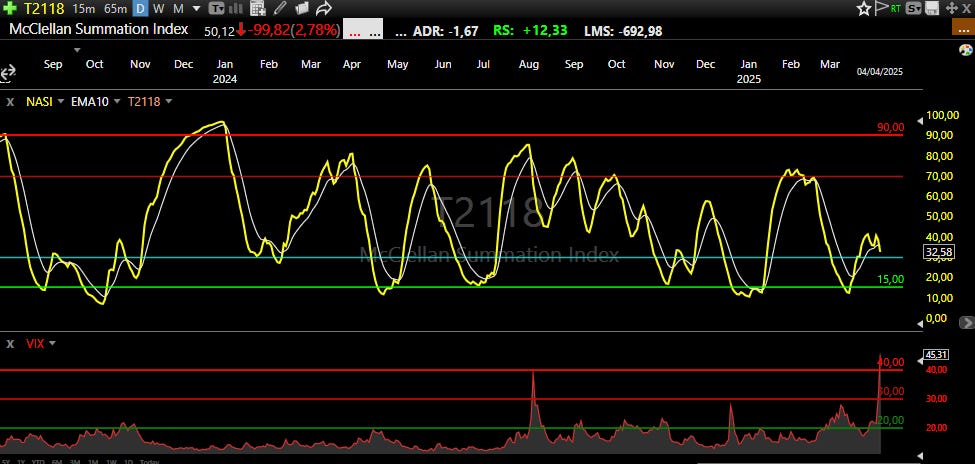
T2118
The T2118 market breadth indicator has shown remarkable resilience, decreasing only slightly to 32.58 despite significant market selloffs and crushing index performance. This unexpected stability contrasts sharply with the VIX volatility index surging above 40, creating a puzzling divergence that demands investor attention.
This unusual disconnect between T2118 and broader market metrics presents two potential scenarios. First, we may be witnessing just the initial phase of a selling cycle, with additional waves likely following a temporary bounce. Alternatively, the underlying market resilience reflected in T2118 could suggest we're approaching a market bottom, with stronger fundamentals than surface volatility indicates.
When comparing T2118 with T2108, the divergence becomes even more pronounced.
Rather than attempting to forecast market movements, our approach remains reactive. We continue maintaining elevated cash positions and focusing on portfolio protection, believing it's prudent to interpret these mixed signals conservatively until market direction becomes more definitive.
T2108
The T2108 breadth metric has plummeted to 7.08 at Friday's close, providing a much clearer picture of market conditions and establishing a definitive game plan for the week ahead. This severe reading approaches but remains above the extreme values of 1.76-3.00 witnessed during the COVID-19 crash, suggesting significant stress but potentially less severe than that unprecedented period.
The most likely scenario for next week appears to be a gap down on Monday-Tuesday followed by a sharp rebound. Whether this potential bounce develops into something more sustainable remains uncertain, particularly as tariff-related concerns continue to evolve.
The 4% Bull-Bear Indicator has reached alarming extremes, with two consecutive days exceeding 1.5k—a rare occurrence previously observed only during the 2022 bear market and 2020 COVID crash. This dramatic reading confirms the intensity of the current selling pressure and market distress.
The 25% Bull-Bear Indicator reinforces that bears maintain firm control over market direction. However, its increasingly parabolic pattern suggests we may be approaching an inflection point that could trigger at least a temporary bounce.

🌱 Support Our Work: Buy Us a Coffee or Shop Our Services! 🌱
Your small gesture fuels our big dreams. Click below to make a difference today.
[☕ Buy Us a Coffee]
[🛒 Visit Our Shop]

Each stock on the watchlist will now have a risk grade badge next to its name, reflecting our assessment based on factors such as volatility, share float, technicals, fundamentals, ADR, and more. This badge is designed to help readers gauge the stock's risk profile, providing valuable context for making informed decisions about approaching it.
High risk: ⚠️
Medium Risk: 📊
Low Risk: 🛡️
🆓✨ Watchlist Essentials: Top Free Picks
CELH: Celsius Holdings 📊
What they do: Health and fitness beverage company
Why watch? 💪 Demonstrating exceptional relative strength against broader market weakness, CELH is now consolidating under the critical $36.00 level. The stock needs a few more days of consolidation to establish a solid base before initiating its next upward leg. This technical pattern typically precedes significant directional movement in momentum stocks.


Put the market on autopilot, experience the Best Platform with TC2000
Explore now →
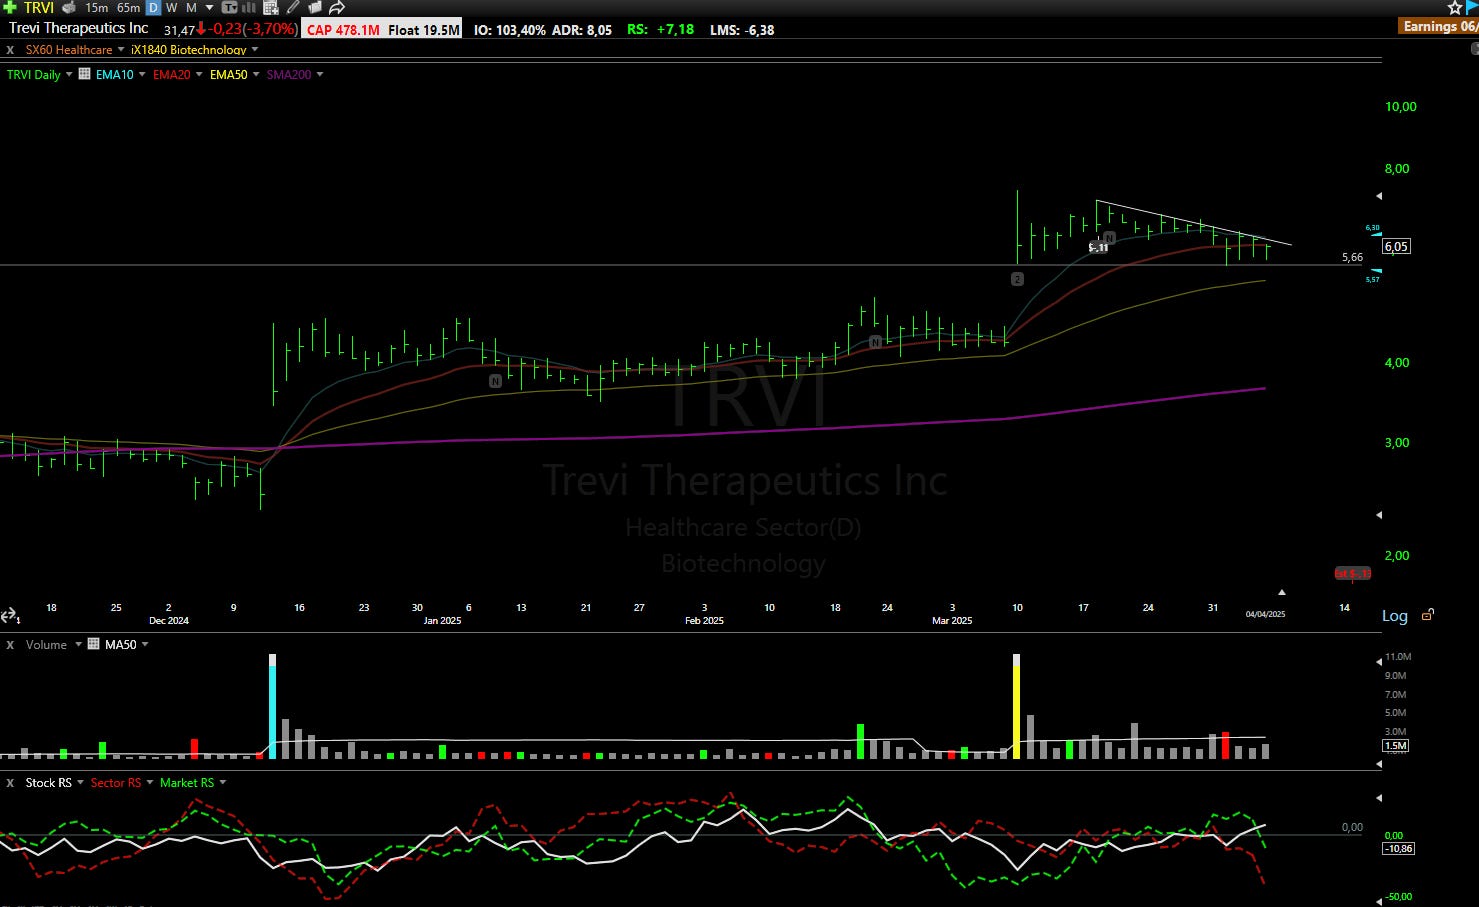
TRVI: Trevi Therapeutics ⚠️
What they do: A Biopharmaceutical company developing treatments for chronic cough and pruritus
Why watch? 💊 TRVI surged over 60% following exceptionally positive earnings and encouraging topline data from Phase 2a trials for refractory chronic cough. With a cash runway extending through the end of 2026, the company's financial position remains solid. The stock must hold the critical $5.66 support level. A break above $6.75 could catalyze the next significant upward movement in this emerging biotech story.
TMDX: TransMedics Group Inc. 📊
What they do: Medical technology company focused on organ transplant solutions
Why watch? 🔬 TransMedics is displaying notable relative strength versus both the broader indexes and its sector peers. The stock is establishing higher lows while consolidating in what appears to be an accumulation phase. A decisive break above the $75.00 resistance level could trigger the next significant leg up in this innovative medical technology leader.

NBIS: Nebius Group NV ⚠️
What they do: Diversified technology company operating in the US and Europe
Why watch? 🌐 The stock formed a promising hammer candlestick pattern on the daily chart and demonstrated resilience during Friday's market decline. This beaten-down name offers geographic diversification with operations spanning both US and European markets. Key technical levels to monitor include $19.50 support and $22.50 resistance—a move above the latter could signal renewed bullish momentum.

💎📈 Watchlist Elite: Premium Market Movers
Each selection undergoes rigorous financial analysis, technical evaluation, and strategic assessment - delivering institutional-grade research.
Every week, we showcase one complete premium analysis at no cost, letting you experience firsthand the depth and quality that sets Elite research apart.
PAGS: Pagseguro Digital Ltd 📊
What they do: Brazilian fintech offering comprehensive banking services
Why watch? 🏦 PAGS has evolved from a payment processor into a full-service digital bank offering current accounts, CDs, lending products, and card services for both B2B and B2C customers. Backed by Brazil's leading media conglomerate, Grupo UOL/Folha, the company benefits from strong institutional support and market recognition.
The investment thesis centers on geographic diversification away from US markets, with Brazil potentially benefiting from changing global trade dynamics. Despite proposed US tariffs, economists suggest Brazil's economy may prove relatively advantageous in this environment, with markets reacting positively to these developments.
Technically, the stock has been under heavy accumulation since early 2025, with $8.50 representing a crucial technical level on both daily and weekly charts.

