

🚀 Wall Street Radar: Stocks to Watch Next Week
💼 Volume 32: 💡 Powell's Spotlight: Fed Meeting Looms as Markets Seek Clarity on Rates

Portfolio updates and new positions:


⚡ AI-optimized, human-verified: Our expert team carefully selected Premium market intelligence from Finchat's data. Explore now →
T2118
The T2118 market breadth indicator has dropped to 12.37, a level not seen since mid-January, just before a significant market bounce. In January, readings below 15.00 quickly reversed, with the indicator surging above 70.00 in less than two trading weeks. The question now is whether history will repeat itself.
Friday’s market action provided encouraging signs that the indexes may be setting up for a more sustained bounce rather than a fleeting one-day rally. The upcoming week will be critical in determining whether this potential recovery gains traction or stalls.
Adding to the optimism, the VIX volatility index has retreated to 21.77 after peaking near 30.00 last week. This decline further supports the case for a market rebound, as it suggests a reduction in traders' fear and uncertainty.

T2108
The T2108 market breadth indicator continues to provide early signals ahead of its T2118 counterpart. On Friday, T2108 showed a notable move upward, climbing from 17 to over 22 in a single session. This sharp increase suggests the potential formation of a leg for a broader market rebound.
The 4% Bull-Bear Indicator reflects that bears remain firmly in control, with Friday being the exception. During Friday’s session, there was a significant surge in high-volume green closes across most stocks. Unlike previous sessions where gains were concentrated in specific sectors, this time the bounce appeared to be more widespread, indicating a general relief rally across the broader market.
The 25% Bull-Bear Indicator continues to show complete dominance by the bears, with no immediate signs of a shift. The broader market sentiment remains damaged, and a meaningful long term recovery will likely require more time to develop.

🌱 Help us help you: Coffee or Shop finds fund our progress and your gains! 🌱

Each stock on the watchlist will now have a risk grade badge next to its name, reflecting our assessment based on factors such as volatility, share float, technicals, fundamentals, ADR, and more. This badge is designed to help readers gauge the stock's risk profile, providing valuable context for making informed decisions about approaching it.
High risk: ⚠️
Medium Risk: 📊
Low Risk: 🛡️
🆓✨ Watchlist Essentials: Top Free Picks
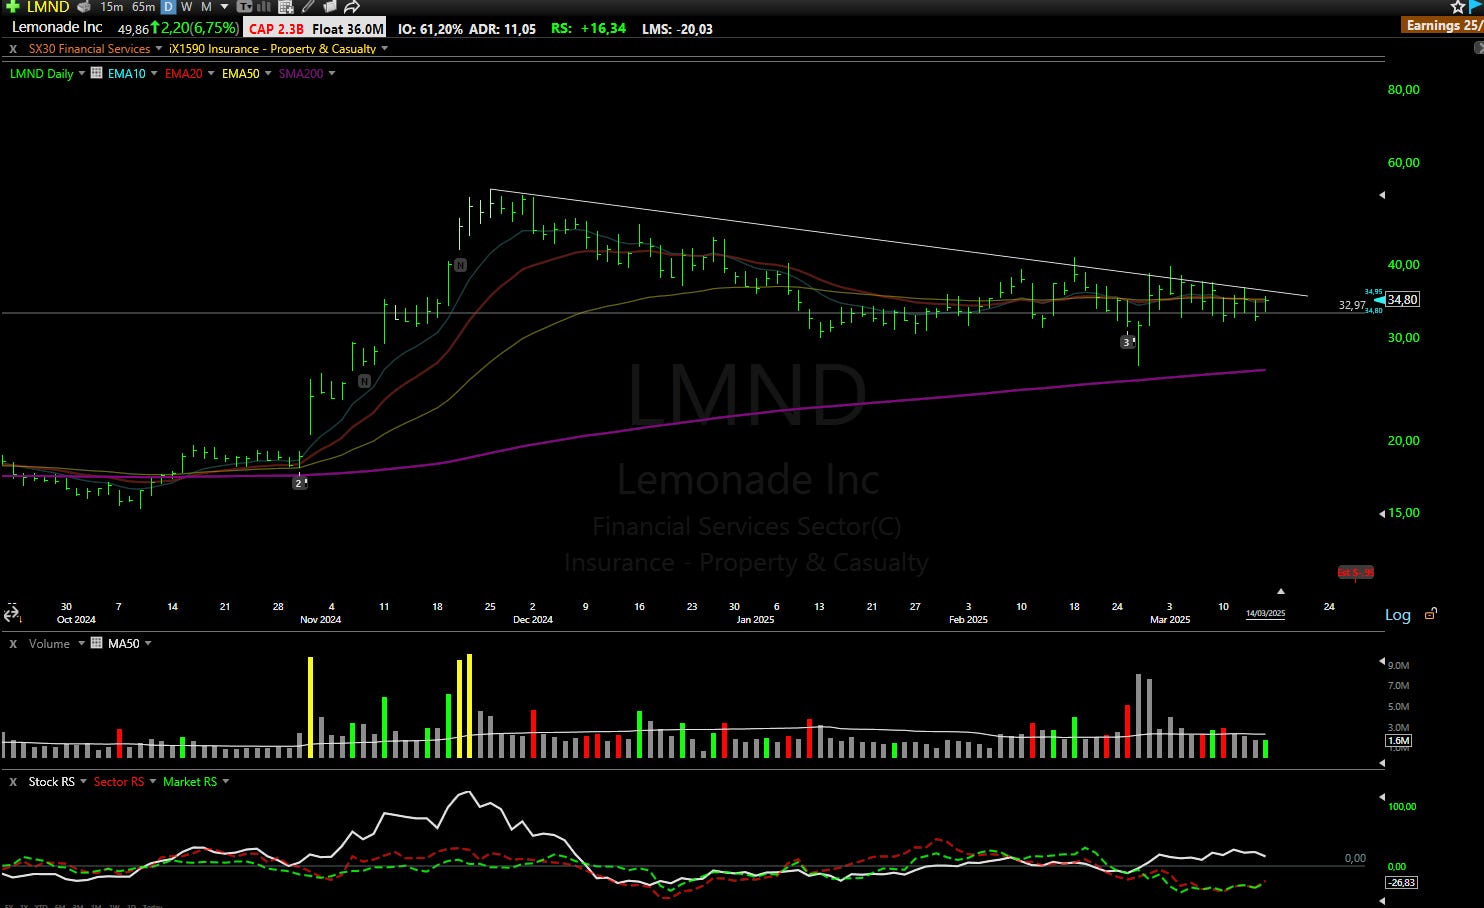
LMND: Lemonade Inc ⚠️
What they do: AI-powered insurance platform
Why watch? 🍋 Demonstrating exceptional strength during market weakness, LMND has firmly held the critical $33 support level. The stock is now approaching a key downtrend line after closing Friday with an impressive 6%+ gain. Operating within one of the market's strongest sectors currently (insurance), LMND shows compelling relative strength versus broader indices. A decisive break above $36 could trigger a new upward leg, potentially unlocking significant momentum as the stock establishes a fresh uptrend phase.

Put the market on autopilot, experience the Best Platform with TC2000
Explore now →
CELH: Celsius Holdings Inc ⚠️
What they do: Energy drink manufacturer
Why watch? 🥤 Despite delivering modest earnings results, CELH recently announced a strategic acquisition of competitor Alani Nu, catalyzing a 40% share price surge. The stock has now consolidated near pre-gap levels while maintaining strong support at the crucial $26 threshold. This technical resilience suggests accumulation dynamics are in play. A move above $28 could facilitate a retest of recent highs, potentially initiating the next phase of upside momentum in this growth story.

PTGX: Protagonist Therapeutics Inc 📊
What they do: Biopharmaceutical company developing peptide-based therapeutics
Why watch? 🧬 PTGX recently experienced a substantial price surge following breakthrough Icotrokinra clinical study results that demonstrate the potential to transform the treatment paradigm for plaque psoriasis. This represents a significant catalyst for the company's long-term growth trajectory. The stock is currently experiencing a temporary pullback on notably diminishing volume—a classic technical pattern suggesting healthy consolidation rather than distribution. Key technical levels to monitor include $54 (recent support) and the $48-50 range (previous all-time highs and gap-up level). The low-volume nature of this pullback is particularly encouraging for potential continuation.

MYE: Myers Industries Inc 📊
What they do: Manufacturer of polymer products for industrial, agricultural, and automotive sectors
Why watch? 📈 Following a robust 40%+ advance after recent earnings, MYE has pulled back on decreasing volume to test the $12.50 level—previously a key resistance zone that may now function as support. Fundamental analysis suggests fair value closer to $15-16, indicating a potential 20-30% upside from current levels. The combination of technical support, recent earnings momentum, and attractive valuation creates a compelling risk-reward profile for this industrial player.

NRSN: NeuroSense Therapeutics Ltd ⚠️
What they do: Clinical-stage biotechnology company developing treatments for neurodegenerative diseases
Why watch? 🧠 NRSN exhibits particularly constructive chart patterns across multiple timeframes, with especially bullish formations visible on weekly and monthly charts. A decisive break above the $1.25 resistance level could trigger significant upside momentum. While an additional pullback on low volume or several more days of consolidation below the trendline would provide a more optimal entry point, the stock's technical setup warrants close monitoring for potential breakout opportunities.

💎📈 Watchlist Elite: Premium Market Movers
Each selection undergoes rigorous financial analysis, technical evaluation, and strategic assessment - delivering institutional-grade research.
Every week, we showcase one complete premium analysis at no cost - letting you experience firsthand the depth and quality that sets Elite research apart.
OPRT: Oportun Financial Corporation ⚠️
What they do: A Financial services company designing products for individuals with low credit scores
Why watch? 💰 Oportun's Q4 results signal a significant operational inflection, with the company posting $9 million in net income and 315% year-over-year growth in adjusted EBITDA despite ongoing revenue challenges. The stock offers substantial downside protection through its tangible book value of approximately $5.35 per share, providing a meaningful margin of safety at current valuation levels.
FY25 profitability metrics are projected to strengthen considerably, with economic earnings expected to exceed $0.75 per share driven by reduced net charge-offs, operational automation, and balance sheet deleveraging. The company's current undervaluation stems from management's strategic missteps between 2021-2023, including questionable acquisitions and unsustainable growth initiatives—issues comprehensively documented by activist investor Findell Capital.
The resulting corporate restructuring, including multiple rounds of workforce reductions and strategic realignment, has positioned the company for sustainable profitability and potential multiple expansions as execution improves.

