🚀 Wall Street Radar: Stocks to Watch Next Week
💼 Volume 29: 🔥 Hot Week Ahead: Virus Fears & NVIDIA's Test
Portfolio updates and new positions:
⚡ AI-optimized, human-verified: Our expert team carefully selected Premium market intelligence from Finchat's data. Explore now →
T2118
The T2118 market breadth indicator has declined significantly to 58.11 from over 70.00 last week, providing validation for cautious positioning in the current market environment. This cooling trend, coupled with the VIX's current reading of 18.21 approaching the critical 20 threshold, suggests that market dynamics may be shifting after an extended period of bullish sentiment. The indicator's behavior aligns with typical late-stage bull market characteristics, where markets often display deceptive strength before significant pullbacks.
The market's recent pattern of reaching new highs before experiencing end-of-week deterioration has vindicated defensive positioning, particularly for investors maintaining substantial cash reserves. Our strategic increase in cash positions from over 50% to now exceeding 60% of the portfolio has provided valuable insulation from Friday's market turbulence, which caught many active traders and investors off guard. This defensive stance appears increasingly prudent given the current market context, where a meaningful correction seems necessary to address mounting speculative excesses.
With the market showing classic late-stage bull market behavior, the prudent approach is to wait and watch until clearer signals emerge.
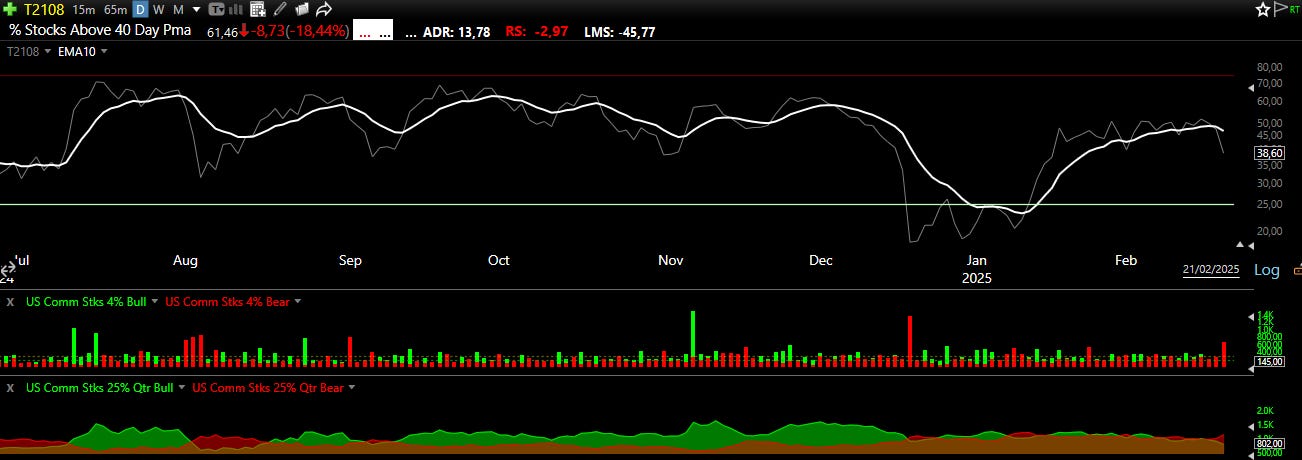
T2108
The T2108 market breadth indicator is demonstrating synchronized movement with its T2118 counterpart, adding significant weight to the current market signals. When these two key indicators move in tandem, their combined message demands heightened attention from market participants. This harmonized deterioration in both indicators serves as a more compelling warning signal than if either were moving in isolation.
The 4% Bull-Bear Indicator has maintained a predominantly bearish stance throughout the week, culminating in a significant bearish candle formation on Friday. This persistent negative bias suggests mounting pressure on market prices and reflects growing concerns about market stability.
The 25% Bull-Bear Indicator has transitioned from choppy conditions to a bearish crossover this week, effectively halting the previous bullish trend. This technical shift represents a significant change in market dynamics and suggests that the path of least resistance may now be to the downside.
🌱 Help us help you: Coffee or Shop finds fund our progress and your gains! 🌱
Each stock on the watchlist will now have a risk grade badge next to its name, reflecting our assessment based on factors such as volatility, share float, technicals, fundamentals, ADR, and more. This badge is designed to help readers gauge the stock's risk profile, providing valuable context for making informed decisions about approaching it.
High risk: ⚠️
Medium Risk: 📊
Low Risk: 🛡️
🆓✨ Watchlist Essentials: Top Free Picks
CI: The Cigna Group🛡️
What they do: Healthcare services and insurance provider
Why watch?🏥 After the earnings miss, the stock demonstrates remarkable resilience, steadily advancing toward the $303 level. All major moving averages are providing robust support, with sector strength offering additional protection against broader market weakness. Technical analysis suggests $330 as the primary target, supported by strong institutional positioning and favorable sector dynamics.
Put the market on autopilot, experience the Best Platform with TC2000
Explore now →
CROX: Crocs Inc 📊
What they do: Innovative footwear manufacturer
Why watch? 👟 The stock is currently consolidating above key moving averages, suggesting optimal entry after a few additional days of consolidation. Price action maintains crucial support at the gap-up level, indicating sustained strength. The technical analysis identifies $111 as the definitive trigger level for upward momentum, with volume patterns supporting a potential breakout.
PII: Polaris Industries Inc 📊
What they do: Leading manufacturer of power sports vehicles, including ATVs, commercial vehicles, Indian Motorcycle, and boats
Why watch? 🏍️ Despite challenging earnings, current valuation metrics appear particularly attractive. Market sentiment suggests widespread acknowledgment of temporary headwinds, potentially already priced into current levels. The stock demonstrates exceptional relative strength against broader market weakness, particularly notable in recent weekly performance. The technical analysis identifies $47.00 as the critical breakout threshold for potential appreciation.
JD: JD.com Inc 📊
What they do: Chinese e-commerce giant
Why watch? 🛒 Amid robust Chinese market momentum, the stock shows controlled consolidation near the crucial $43.00 level. Technical formation suggests potential for continued upward movement, with success contingent upon sustained strength in the broader Chinese market theme. Current price action indicates accumulation patterns supporting potential breakout.
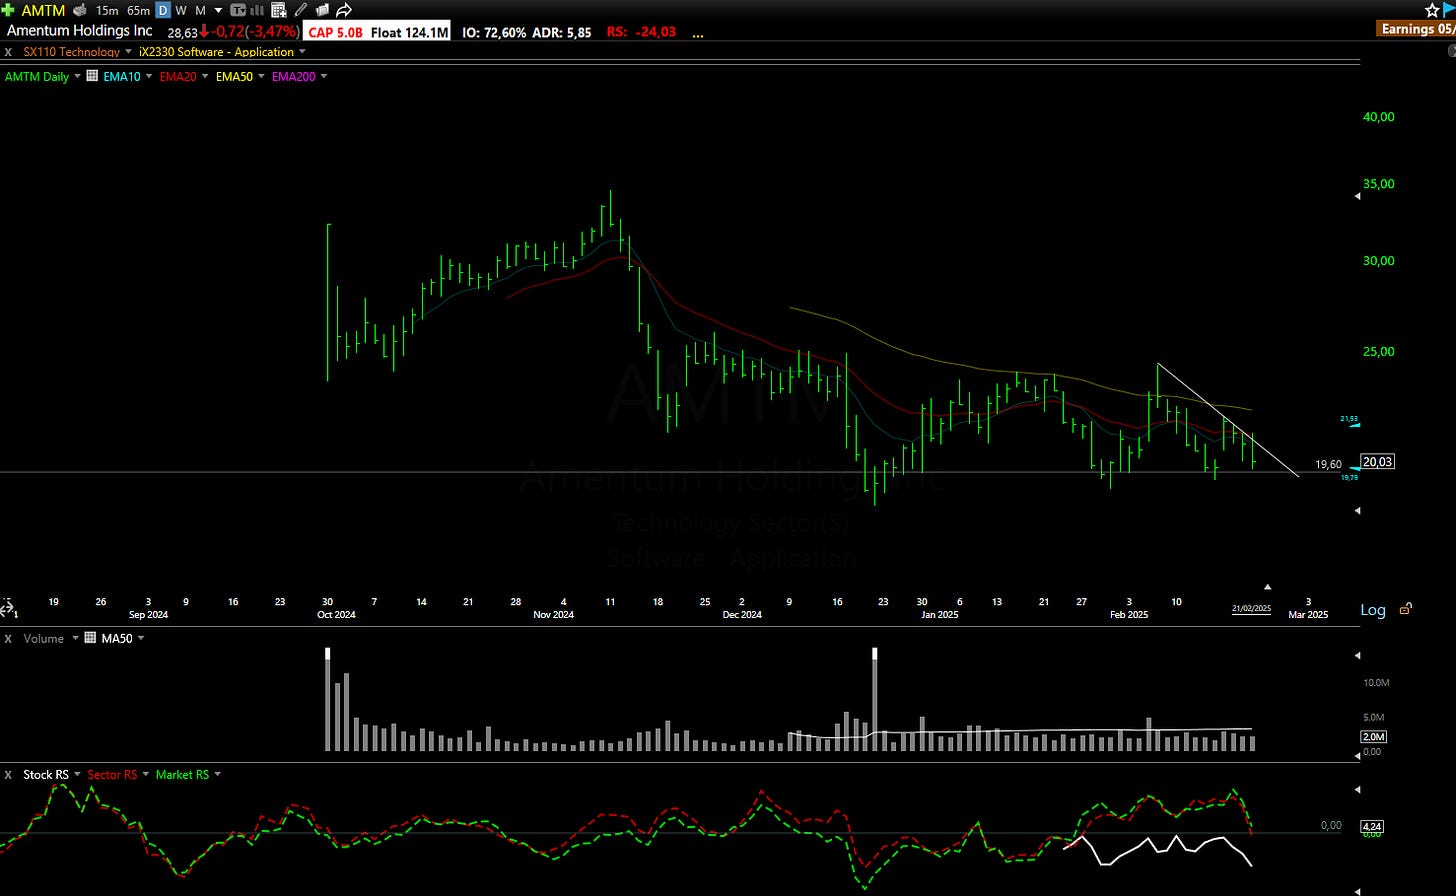
AMTM: Amentum Holdings Inc ⚠️
What they do: Defense and engineering services provider
Why watch? 🛡️ For watchlist followers check last week's analysis, AMTM approaches its fourth test of critical $19.50 support. Technical analysis suggests strong accumulation patterns, with $21.00 representing the key breakout threshold required for potential acceleration. Current price action indicates institutional interest building at these levels.
ANAB: AnaptysBio Inc ⚠️
What they do: Clinical-stage biotechnology company
Why watch? 🧬 Following breakthrough Phase II rheumatoid arthritis trial results, the stock surged 70% in just three days. Current consolidation above $18.00 shows decreasing volume, suggesting healthy price action. Technical analysis reveals a potential trendline breakout opportunity, with strong fundamentals supporting continued momentum.
💎📈 Watchlist Elite: Premium Market Movers
Each selection undergoes rigorous financial analysis, technical evaluation, and strategic assessment - delivering institutional-grade research.
Every week, we showcase one complete premium analysis at no cost - letting you experience firsthand the depth and quality that sets Elite research apart.
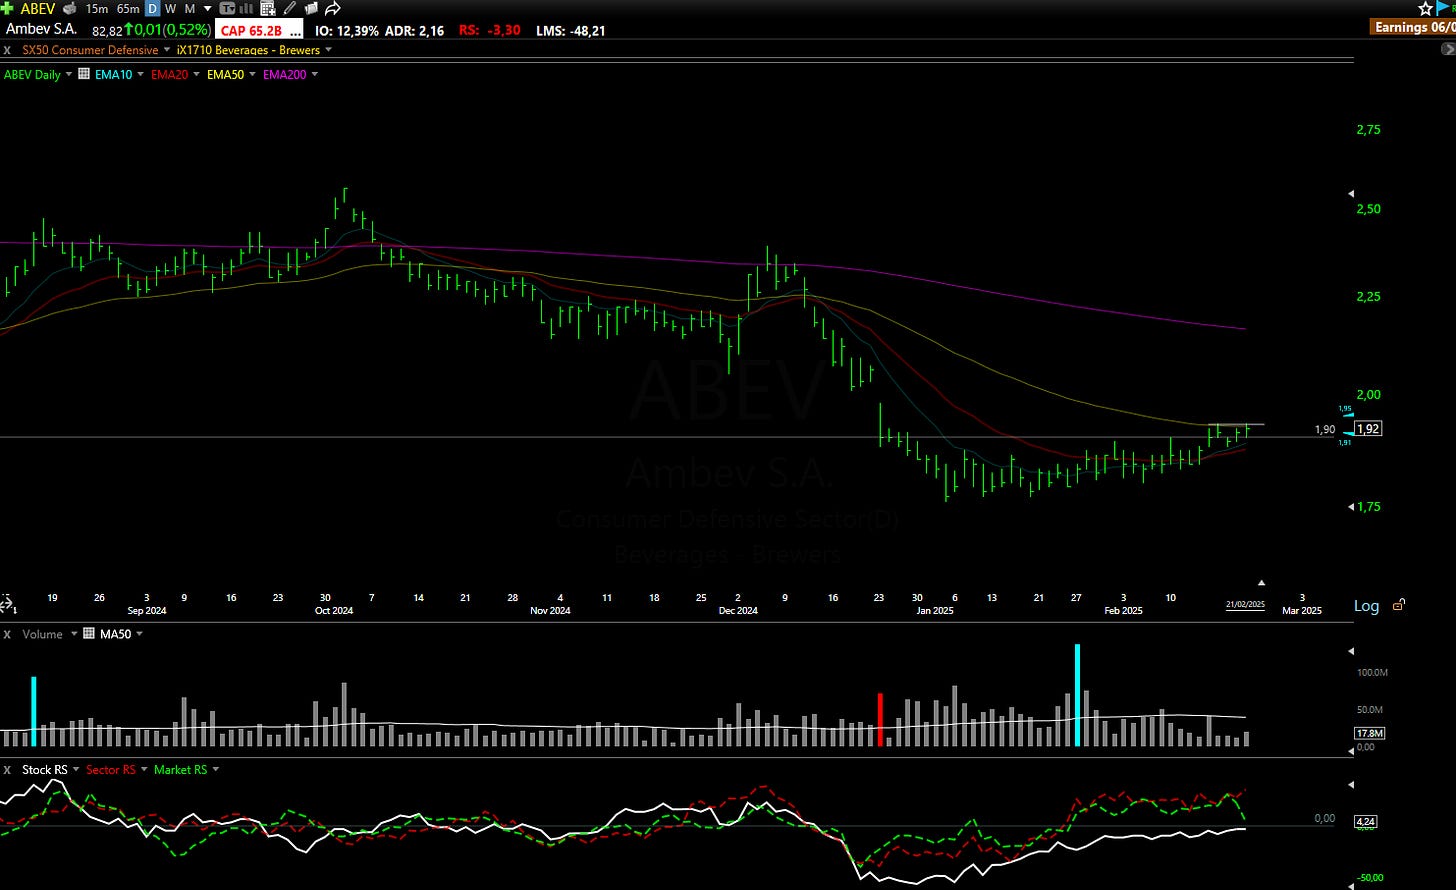
ABEV: Ambev S.A. 🛡️
What they do: Leading beverage manufacturer and distributor (62% owned by Anheuser-Busch InBev)
Why watch? 🍺 Following Warren Buffett's strategic entry into Constellation Brands, Ambev presents a compelling parallel opportunity. Current valuation metrics are at their lowest since the 2009 Great Recession bottom. The stock successfully broke and retested the $1.90 level, forming a saucer pattern with the 50-EMA acting as resistance at $1.93-1.94. Technical analysis suggests 60-100% upside potential over 12-24 months, supported by an attractive 12.3% free cash flow yield. Potential Brazilian real strengthening could provide an additional catalyst for share appreciation.


