

🚀 Wall Street Radar: Stocks to Watch Next Week
💼 Volume 26: 📈 Trade Tensions Soar: Trump's Tariffs Spark Global Retaliation 🌎

The past week saw heightened market volatility, presenting exceptionally challenging conditions for active trading. Despite these headwinds, we successfully established several new strategic positions across key sectors. However, Friday's session concluded on an exceptionally weak note, contrasting sharply with the intraday rally that saw major indices surge over 1% before reversing gains into the close.
Looking ahead, renewed tariff rhetoric from former President Trump is likely to inject near-term volatility into equity markets at Monday's open. Investors should brace for potential whipsaw price action as the narrative unfolds.
From a risk management perspective, our team will prioritize protecting unrealized profits by executing prudent partial profit-taking in positions exhibiting signs of technical vulnerability. This measured approach will focus primarily on trades where price action breaches critical support levels or lacks sufficient cushion to absorb further turbulence.
(please check our Market Monitor for additional information)
🌱 Help us help you: Coffee or Shop finds fund our progress and your gains! 🌱

T2118
The T2108 breadth indicator has surged to 73.09, decisively breaching the critical 70.00 threshold that historically precedes equity market pullbacks. This overextension signals overheating in market breadth, raising contrarian concerns as participation becomes excessively skewed toward bullish sentiment. Compounding these risks, the VIX volatility index has climbed sharply from 12 to 16 over the past week, reflecting mounting anxiety ahead of potential Trump-era tariff announcements. Analysts now warn that geopolitical turbulence—specifically aggressive trade measures targeting China or the EU—could propel the VIX above 20 in the coming sessions, particularly given thin liquidity conditions.

T2108
The T2108 breadth indicator is flashing warning signs, forming a concerning double-top pattern even as major indexes pushed higher during the week. This divergence suggests the recent market advance lacks broad participation, with not all constituent stocks contributing to the upward momentum.
Adding to the cautionary signals, the 4% Bull-Bear Indicator has shown predominantly bearish readings despite the market's ascent, marking a notable shift from previous periods of strength. This disconnect between price action and underlying momentum metrics warrants attention from market participants.
Perhaps most significantly, the quarter Bull-Bear indicator has begun transitioning from green to red territory, providing yet another technical confirmation that market dynamics may be shifting. The confluence of these breadth indicators—the T2108 double top, weakening 4% Bull-Bear readings, and the quarter indicator's bearish crossover—paints a picture of potentially waning momentum.

Portfolio updates and new positions:


⚡ AI-optimized, human-verified: Our expert team carefully selected Premium market intelligence from Finchat's data. Explore now →
Each stock on the watchlist will now have a risk grade badge next to its name, reflecting our assessment based on factors such as volatility, share float, technicals, fundamentals, ADR, and more. This badge is designed to help readers gauge the stock's risk profile, providing valuable context for making informed decisions about approaching it.
High risk: ⚠️
Medium Risk: 📊
Low Risk: 🛡️
🆓✨ Watchlist Essentials: Top Free Picks
GRO: Brazil Potash Corp ⚠️
What they do: Potash mining and fertilizer production
Why watch? 🌱 The stock has experienced one of the most severe post-IPO declines in recent memory, plummeting 72% in just two months. However, technical analysis reveals strong support at the $4.00 level, which has been successfully tested twice. A breakthrough above $4.75 could catalyze a significant technical bounce, making this a compelling watch despite the high-risk profile.


Put the market on autopilot, experience the Best Platform with TC2000
Explore now →
ICCM: Icecure Medical Ltd ⚠️
What they do: Cryoablation medical technology
Why watch? 🏥 The daily chart exhibits a textbook VCP (Volume Contraction Pattern), with the line of least resistance established at $1.30. The weekly timeframe reinforces the bullish setup with a well-defined Cup & Handle formation. The next significant resistance level is $1.45, offering a clear technical target for momentum traders.

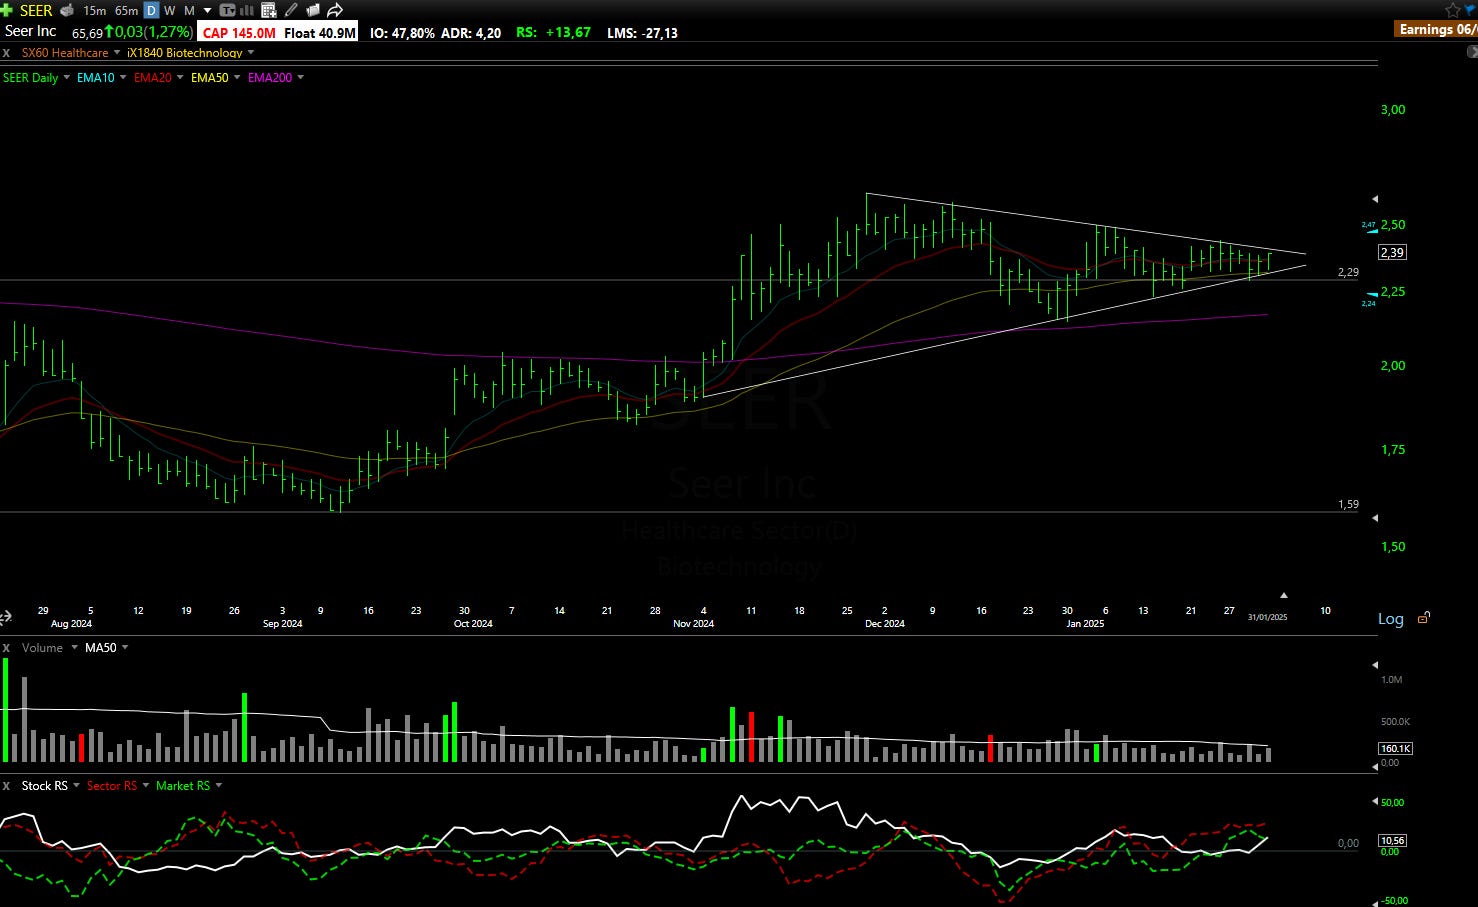
SEER: Seer Inc 📊
What they do: Proteomics platform technology
Why watch? 🧬 The stock mirrors ICCM's daily pattern formation while demonstrating remarkable price stability throughout 2024, maintaining a defined range between $1.60 and $2.30. The recent breakout and subsequent retest of the $2.30 level provide a strategic entry point, with the potential for significant upside movement above the $2.40-2.45 resistance zone.
EXFY: Expensify Inc 📊
What they do: Expense management software solutions
Why watch? 💼 The stock requires additional consolidation days before potential advancement. A clear resistance level at $3.79 has repeatedly rejected upward movement, indicating persistent selling pressure at this level. Volume analysis suggests institutional accumulation, making the eventual breakout potentially more significant.

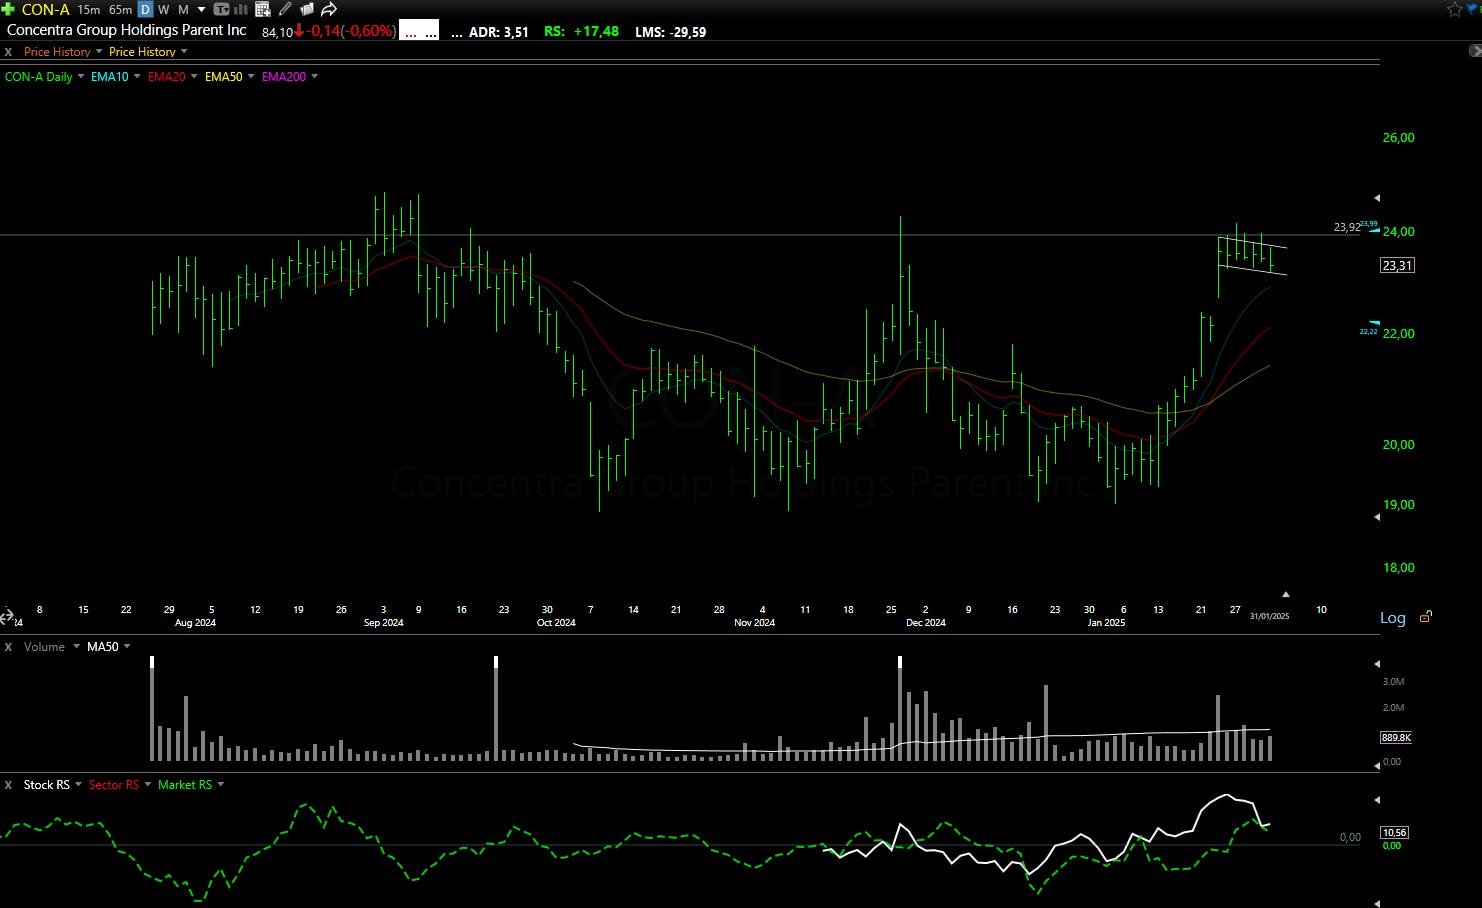
CON: Concentra Group 🛡️
What they do: Healthcare services provider
Why watch? 🏥 This recent IPO demonstrates mature technical development through a double cup formation. After an initial rejection at the $24.00 level in November, the stock has formed another cup with a handle pattern and is currently consolidating below the crucial $24.00 resistance. A breakthrough could propel the stock to new all-time highs.
ABT: Abbott Laboratories 🛡️
What they do: Global healthcare products manufacturer
Why watch? 📈 The January 22nd Q4 earnings release showcased impressive performance with revenue reaching $10.97 billion, representing a 7.2% year-over-year increase, primarily driven by robust Medical Devices segment growth. The company's 2025 guidance projects revenue growth of 7.5-8.5% with adjusted diluted EPS between $5.05 and $5.25. Technically, the stock is forming a flag pattern following its initial surge, with $130.00 serving as the key breakout level.

💎📈 Watchlist Elite: Premium Market Movers
