

🚀 Wall Street Radar: Stocks to Watch Next Week
💼 Volume 34: 🧯 Fire Sale or Falling Knife? Navigating Tech's Bloodbath

Portfolio updates and new positions:


⚡ AI-optimized, human-verified: Our expert team carefully selected Premium market intelligence from Finchat's data. Explore now →
T2118
The T2118 market breadth indicator has retreated to 37.91, showing a downward hook following Friday's significant market selloff. This reversal interrupts the recent upward momentum and signals potential market weakness ahead.
Adding to investor concerns, the VIX volatility index has climbed back above the critical 20.00 threshold, indicating renewed market anxiety and uncertainty. This volatility gauge's upward movement provides further evidence that market turbulence may continue.
The brief market bounce that lasted only a couple of days has effectively erased gains, bringing indexes back to levels seen approximately two weeks ago. For bulls, the March lows now represent a crucial support zone and the last line of defense before a potentially deeper correction materializes.
The start of next week will be decisive for market direction. At GB Capital, we've used the past week to strategically liquidate positions without cushion and significantly increase our cash reserves. Rather than chasing diminishing returns, we're prioritizing portfolio protection—it's better to be safe than sorry in the current environment.

T2108
The T2108 breadth metric currently stands at 24.20, precariously close to the critical 20.00 support level. A breach below this threshold would likely confirm that the market correction remains active and potentially signal further downside ahead for equities.
The 4% Bull-Bear Indicator delivered a clear verdict on last week's market action, revealing persistent weakness for bulls even during the attempted bounce. Friday's session proved particularly devastating, with a substantial red bar demonstrating bears' complete reassertion of control over short-term market direction.
The 25% Bull-Bear Indicator increased to 1.6k, approaching recent highs of 1.8k. This long-term sentiment gauge reinforces the bearish outlook, suggesting that investors should prepare for extended downward pressure in the coming weeks.

🌱 Support Our Work: Buy Us a Coffee or Shop Our Services! 🌱
Your small gesture fuels our big dreams. Click below to make a difference today.
[☕ Buy Us a Coffee]
[🛒 Visit Our Shop]

Each stock on the watchlist will now have a risk grade badge next to its name, reflecting our assessment based on factors such as volatility, share float, technicals, fundamentals, ADR, and more. This badge is designed to help readers gauge the stock's risk profile, providing valuable context for making informed decisions about approaching it.
High risk: ⚠️
Medium Risk: 📊
Low Risk: 🛡️
🆓✨ Watchlist Essentials: Top Free Picks
CACI: CACI International Inc 📊
What they do: Defense and intelligence technology solutions
Why watch?💪 Demonstrating exceptional relative strength against broader market weakness, CACI closed green on Friday despite significant index declines. The stock is currently finding strong support at both the 10 and 20 EMAs, establishing a solid technical foundation. A decisive break above the $380 level could trigger the next significant upward movement in this defense sector leader. We made a deep dive HERE


Put the market on autopilot, experience the Best Platform with TC2000
Explore now →
FSLR: First Solar Inc. 📊
What they do: Solar panel manufacturing and renewable energy solutions
Why watch? ☀️ Similar to CACI, First Solar has displayed remarkable relative strength during recent market turbulence, particularly on Thursday and Friday. While descending triangles typically signal a bearish sentiment, a breakout above the critical $129.00 resistance level with increased volume could invalidate this pattern and fuel a substantial upward move. This price point also represents significant support from late 2023, adding technical significance to this level.

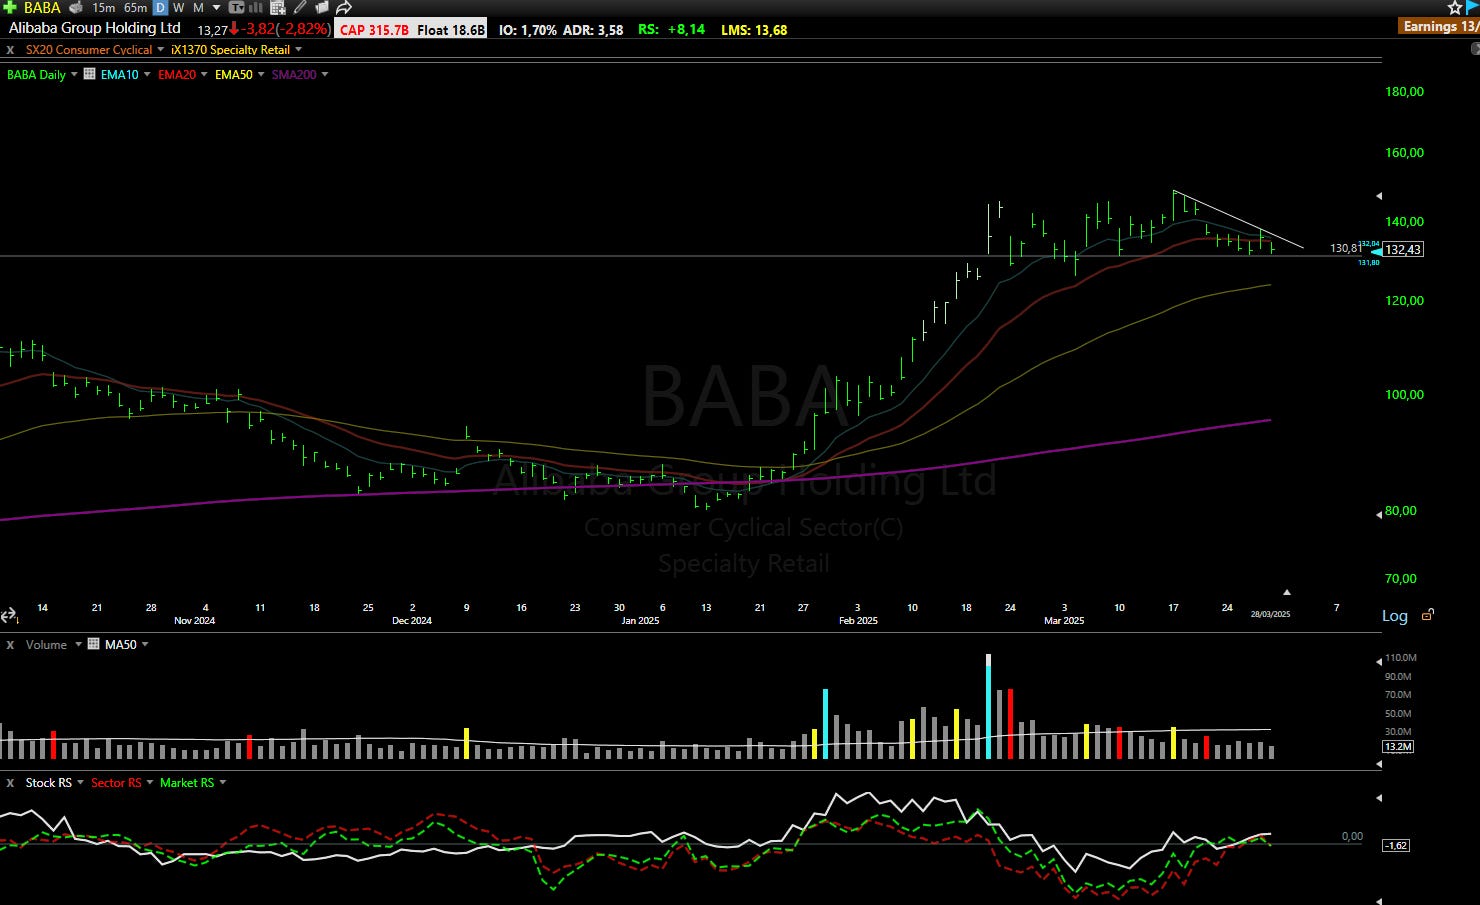
BABA: Alibaba Group Holding Inc 🛡️
What they do: E-commerce and cloud computing conglomerate
Why watch? 🛒 Alibaba is approaching a crucial support level at $130 after experiencing significant price appreciation in 2025. The stock must now consolidate and successfully defend this threshold while digesting recent gains. This setup presents an attractive risk/reward opportunity for investors monitoring this key technical level.
TRVI: Trevi Therapeutics ⚠️
What they do: Biopharmaceutical company developing treatments for chronic cough and pruritus
Why watch? 💊 TRVI surged over 60% following the release of exceptionally positive earnings and encouraging topline data from Phase 2a trials for refractory chronic cough. With a cash runway extending through the end of 2026, the company's financial position remains solid. The 10 EMA has consistently supported the stock price during this advance. A break above $6.75 could catalyze the next significant upward movement in this emerging biotech story.

💎📈 Watchlist Elite: Premium Market Movers
Each selection undergoes rigorous financial analysis, technical evaluation, and strategic assessment - delivering institutional-grade research.
Every week, we showcase one complete premium analysis at no cost - letting you experience firsthand the depth and quality that sets Elite research apart.
HLF: Herbalife Ltd 📊
What they do: Global nutrition and direct selling company
Why watch? 🥤 Wall Street responded positively to recent earnings despite declining sales, focusing instead on Herbalife's robust transformative digital strategy to enhance distributor engagement and business operations. Q4 2024 results exceeded expectations, with adjusted EBITDA reaching $150 million, surpassing forecasts. The company has achieved 22% year-over-year distributor growth for three consecutive quarters while successfully repaying $250 million in debt, strengthening its financial position.
Technically, the stock is consolidating above the 200-EMA with decreasing volume—typically a precursor to directional movement. This defensive sector has performed exceptionally well during the recent market downturn, suggesting continued resilience. The stock likely needs several additional days of sideways consolidation to establish a solid base before initiating its next upward leg.

