


💼 Inside the Portfolio: Updates from our Swing Trading Desk #05-2025
We're opening the books on last month's trading activity, with detailed charts and commentary

Welcome back to "Inside the Portfolio”!
We're excited to announce a significant evolution for this series, designed to bring you even more value and transparency.
Previously, "Inside the Portfolio: Updates from our Swing Trading Desk" was your go-to piece for an in-depth look each time we added a new stock to our holdings. We dived deep into the rationale and analysis behind those specific additions.
Now, we're shifting gears. While our real-time thoughts, stock considerations, daily market commentary, and our medium to long-term ideas are now shared directly and dynamically within our exclusive chat community (more on that in a moment!), this revamped "Inside the Portfolio" article will serve a new, broader purpose.
From now on, this article will be a monthly recap of all trades and operations we've undertaken. The best part? It will be completely free for all subscribers. This new format is designed to be a valuable resource in two key ways:
Performance Transparency: This will provide a clear and consistent way for you to evaluate our trading performance every month.
Educational Insights: Beyond just listing trades, we'll provide details on why we chose specific operations, including technical analysis points and broader market considerations that informed our decisions. This makes it a fantastic study tool, whether you're looking to understand our strategy or learn from real-world trading examples.
For those immediate, in-depth discussions and the day-to-day pulse of our trading desk (the kind of insights previously found in the old format), we invite you to join our chat community. That's where the granular analysis and timely updates now live!

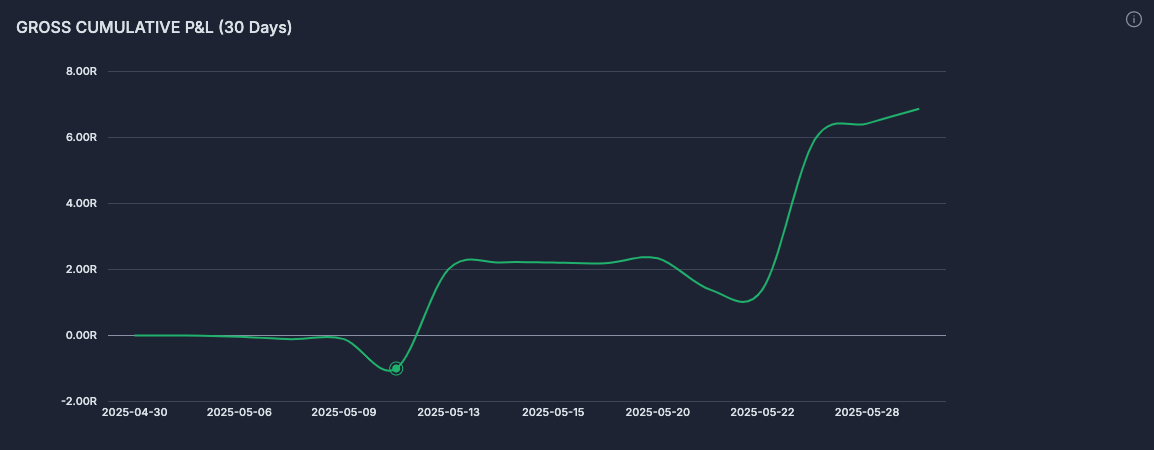
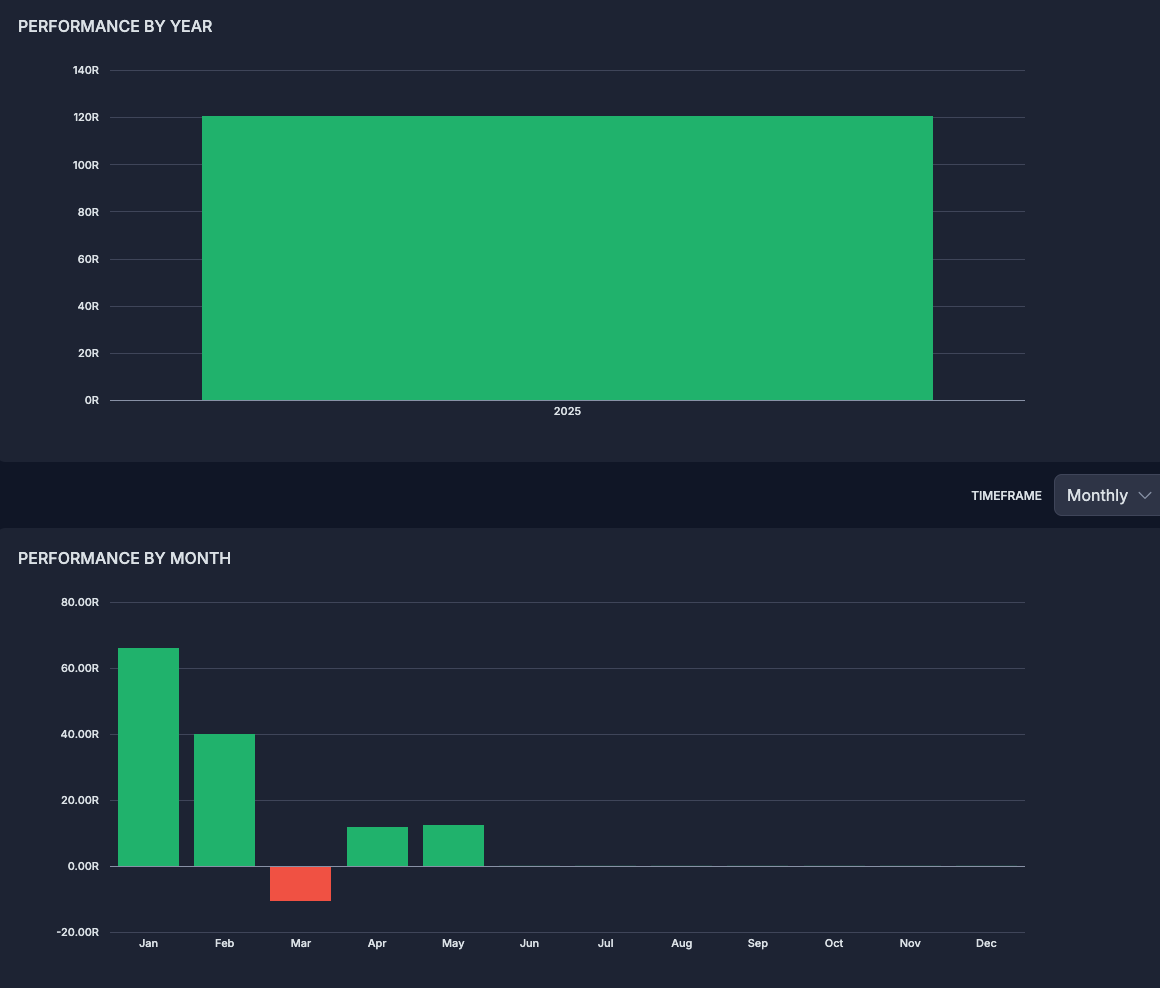
May 2025 Gross Profit: 6.87R
May 2025 Open Profit: 8.72R

TRADE #1: ASPI - Bullish Wedge Breakout
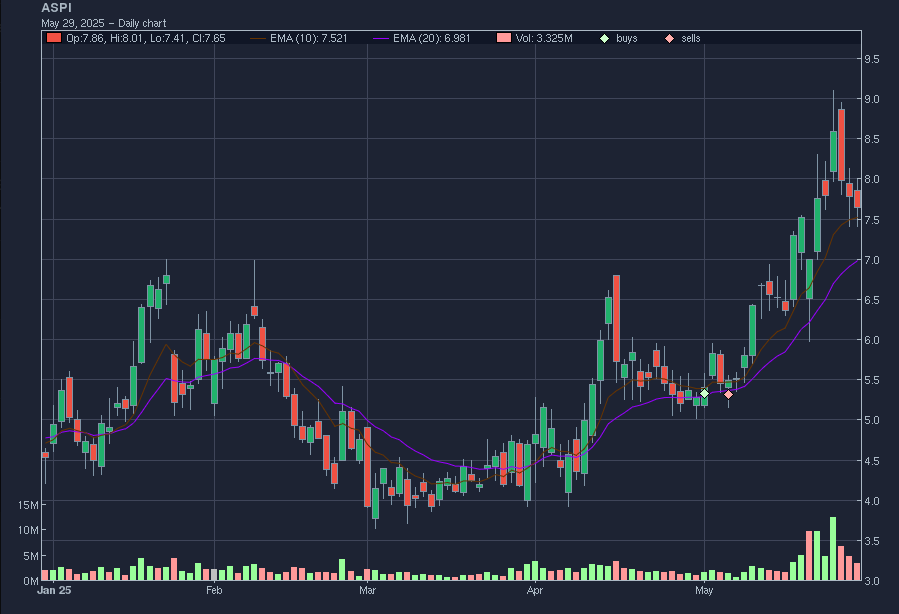
The Scene: ASPI was a company we studied extensively in the past, trading it a few times in the 2's and 3's before Substack. We liked the project and the company. The nuclear theme was somewhat dormant at the time, but we believed it could be reignited after realizing that the AI and data center theme wasn’t dead after all.
The Spark: Perfect cup & handle formation, support at 5.00 level, the handle was also a bullish wedge forming on low volume. We saw the stock break out on May 6 and initiated a position the same day.
The Journey: After two days, we were almost 10% in profit and mistakenly decided to set the stop at breakeven, thinking we had an easy win and could sit back and relax. Nope! We experienced two significant down days, giving us the sense that the breakout had failed. After we were stopped out, almost to the penny, the stock reversed and gained over 70% in a matter of weeks.
The Conclusion:
We could have considered a split stop-loss: 50% of the position protected at break-even and the other 50% at our initial stop below $5.00. This would have capped a full reversal at a 0.5R loss, while allowing us to hold a portion of the position for further upside and potentially scale in if the trend continued.
TRADE #2: SEZL - Episodic Pivot
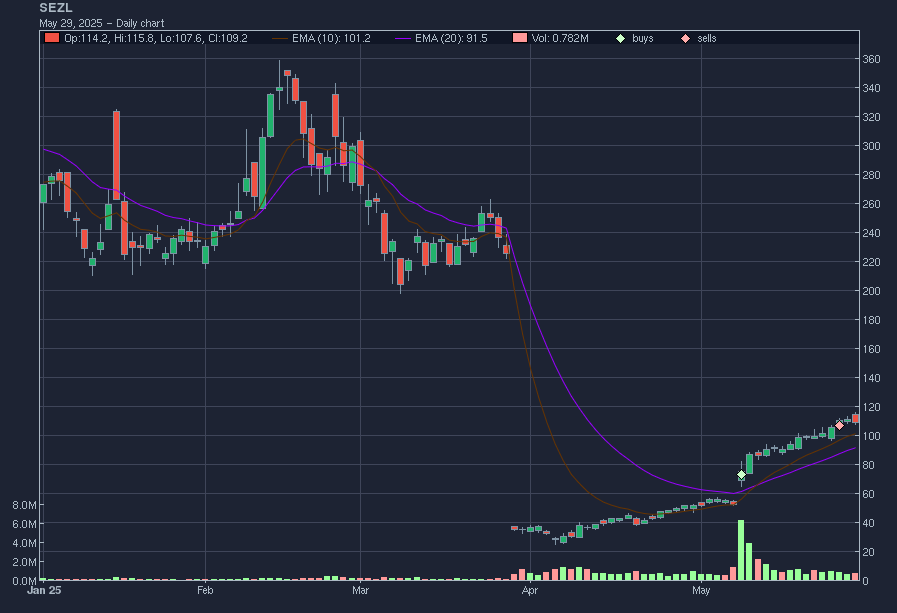
The Scene: SEZL experienced a significant bullish gap-up following the release of an exceptionally strong earnings report, which appeared to exceed Wall Street's consensus expectations. Our pre-market due diligence on the earnings report confirmed strong underlying fundamentals, distinguishing SEZL from speculative, lower-quality stocks prone to unsustainable, high-percentage gaps often driven by non-fundamental factors or excessive dilution. This initial analysis suggested the upward price movement had a legitimate basis.
The Spark: For such earnings-driven gap-ups, our typical approach involves setting an initial stop-loss order just below the day's low to manage downside risk. Given the substantial magnitude of the gap in SEZL, we initiated a conservative, smaller-than-usual position. This was a deliberate risk management decision to mitigate potential losses should the initial upward momentum falter and the stock experience a "gap fill" or "fade."
Our entry was slightly delayed relative to an optimal Opening Range Breakout (ORB) strategy, which often targets entries on the 1-minute or 5-minute charts. However, our preference is often to allow for initial market volatility to subside post-open, letting the "dust settle" before committing capital, even if it means a slightly less advantageous entry point.
The Journey: The subsequent price action was remarkably smooth and bullish. SEZL exhibited consistent upward momentum, trending higher on most trading days following the initial gap. This type of sustained follow-through buying is characteristic of the most powerful Episodic Pivots (EPs), where institutional demand often builds over time. We strategically took partial profits by selling a portion of our holding near recent highs to lock in gains, while retaining over 50% of the initial position to participate in further potential upside. Regrettably, the initial conservative position sizing means the remaining holding, while profitable, is relatively small in absolute terms.
The Conclusion:
Overall, we are satisfied with our trade management on this occasion, particularly the adherence to our risk parameters given the initial gap size. For an ideal execution, an earlier entry, perhaps closer to the ORB, and with a larger initial position size, would have maximized returns. However, achieving such precision in real-time, especially with significant gap scenarios presenting wider initial risk, is invariably challenging, a classic case of "easier said than done." The trade reinforces the power of fundamentally sound companies reacting positively to earnings surprises.
TRADE #3: SRPT - Bottom Bounce
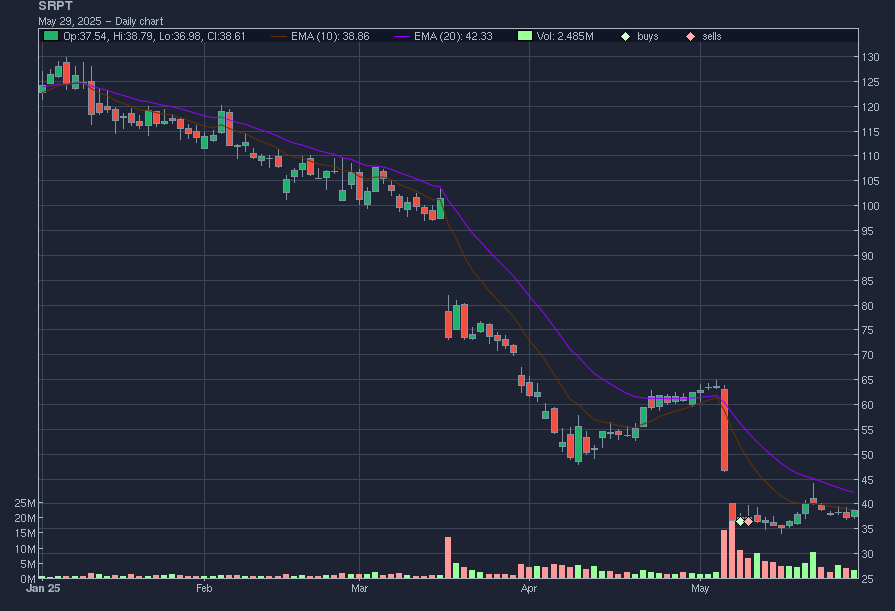
The Scene: Sarepta Therapeutics (SRPT) faced a confluence of adverse developments in May. Disappointing earnings results were compounded by the deeply concerning news of a patient fatality linked to one of its therapies. This dual negative catalyst accelerated an already significant downtrend, causing the stock to plummet from approximately $65 to the $35 level. This decline was particularly stark given that SRPT had already seen its valuation halve from its January peak near $130, culminating in an over 75% depreciation in roughly four months.
The Spark: Our analysis turned to the monthly chart, where a significant historical demand zone between $35 and $40 became apparent. This zone had previously served as both support and resistance in 2016 and preceding years, notably acting as a springboard for a threefold increase in the stock's value from that 2016 base. This historical price action suggested the $35 level could offer substantial support.
Further investigation into the market's reaction to the recent news indicated a potential overreaction. While the patient fatality was a serious and tragic event, the severity of the stock's decline appeared disproportionate when weighed against the company's established commercial operations, evidenced by revenues exceeding $1.5 billion.
The technical trigger for entry emerged after two sessions of intense selling pressure. On the third day, price action stabilized, forming a small Doji candlestick on significantly lower volume compared to the preceding sell-off days. This pattern often signals potential seller exhaustion. Entry was initiated with a stop-loss placed just beneath the critical $35.00 support. Confirmation for this entry was sought on an intraday chart (e.g., 65-minute), where candlestick patterns reinforced the defense of the $35.00 level by buyers.
The Journey: Following the entry, the position moved favorably almost immediately. The subsequent trading session saw SRPT rally by approximately $4-5 per share, a significant intraday gain. Confident in the initial thesis and seeking to protect capital, the stop-loss was adjusted to the breakeven point. However, before the market closed, a retracement in price triggered this adjusted stop, liquidating the position at breakeven.
The Conclusion:
The initial timing and entry execution were sound, capitalizing on a confluence of technical and sentiment-based factors. A key refinement in trade management would have been to secure partial profits when the position achieved a substantial intraday gain. While the risk was effectively managed by moving the stop to breakeven, capturing some profit would have been a prudent measure.
Beyond immediate trade management, a crucial takeaway is the importance of continued monitoring of a stock even after an exit. SRPT, after our breakeven stop-out, subsequently underwent a period of consolidation around the key support level. This consolidation ultimately resolved in the upward bounce we had initially anticipated, highlighting a missed re-entry opportunity due to removing the stock from active watch too soon.
TRADE #4: UNH - Bottom Bounce
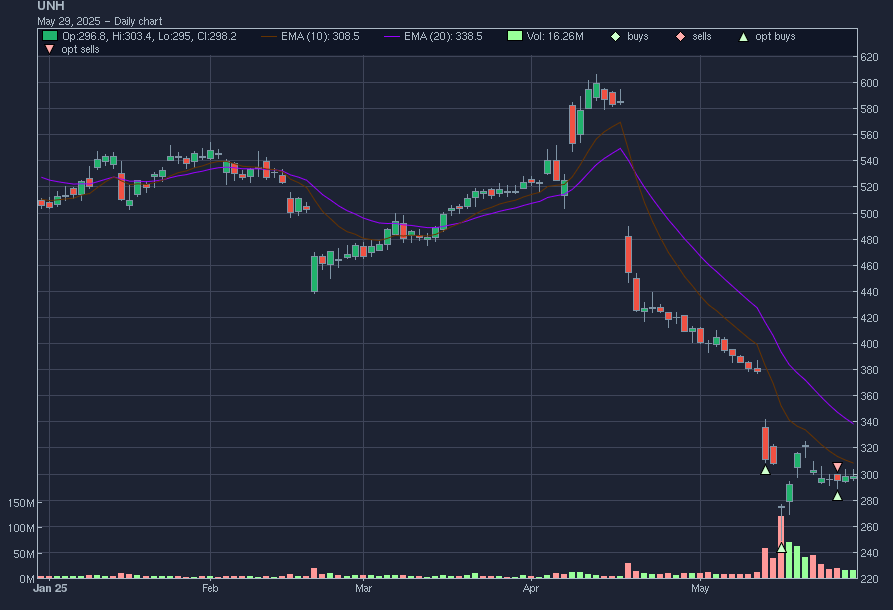
The Scene: UnitedHealth Group (UNH), a leading U.S. health insurer, experienced a market dynamic reminiscent of the Sarepta Therapeutics situation. Adverse news flow triggered a precipitous sell-off, effectively halving the company's market capitalization within a few weeks. Despite this sharp decline, UNH's status as a blue-chip entity with substantial operations remained intact. Furthermore, from a valuation perspective, the stock appeared increasingly attractive as it approached the sub-$300 per share level.
The Spark: Following a significant gap down, UNH shares plunged over 10% in a single trading session. To avoid the inherent risks of "catching a falling knife" with direct equity in such a volatile environment, a strategic decision was made to establish a position using LEAPS (Long-term Equity Anticipation Securities). This options-based approach offered a defined risk profile and an extended time horizon, aligning with the view that UNH's fundamental quality warranted a longer-term investment perspective if necessary.
The initial entry point was not perfectly timed. However, observing the price action on an intraday basis (specifically, the 65-minute chart), a subsequent opportunity to augment the position was identified. This addition was executed after a discernible higher low formed, suggesting a potential stabilization and nascent buyer interest, thereby improving the average cost basis of the LEAPS position.
The Journey: This UNH LEAPS position has since transitioned into our long-term portfolio and remains an active holding. It's pertinent to note a minor operational misstep during this period involving an erroneous purchase followed by an immediate sale of additional contracts; this, however, did not materially impact the core strategic holding.
The Conclusion:
The position experienced a substantial unrealized gain following a sharp three-day rally in UNH shares. In retrospect, a more optimal trade management approach would have involved realizing partial profits, perhaps divesting 20-30% of the position. Such a move would have served to "finance the trade" by recouping a portion of the initial outlay and reducing overall risk, while still allowing the majority of the position to benefit from the anticipated long-term appreciation. Despite this missed profit-taking opportunity, the core thesis for a long-term holding in UNH remains, underpinned by its strong market position and fundamental outlook.
TRADE #5: BULL - Bottom Bounce
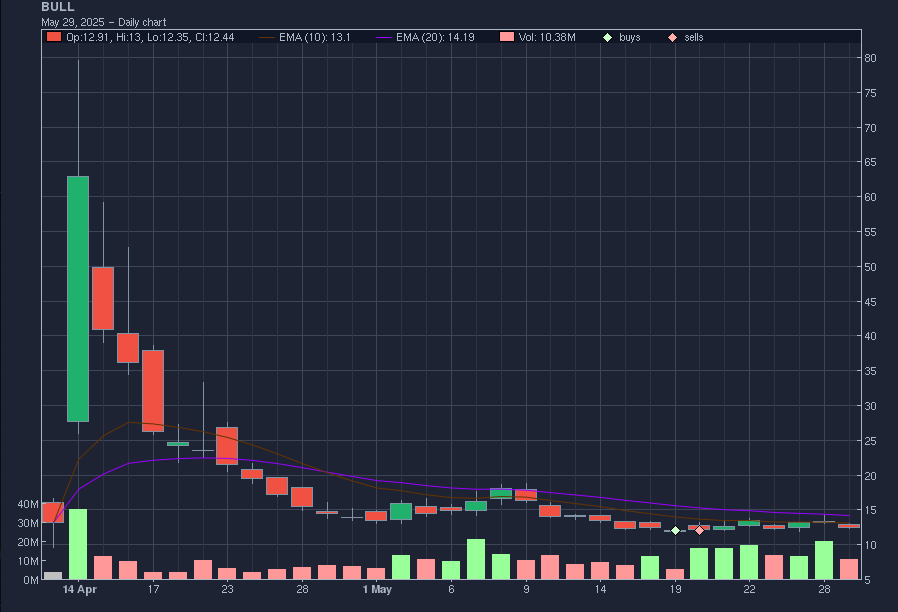
The Scene: WeBull Corp, a recent Initial Public Offering (IPO), exhibited the extreme price volatility often characteristic of newly listed equities. The stock experienced a parabolic ascent, multiplying its value approximately sevenfold within a remarkably short period post-launch. This was followed by an equally precipitous decline, with the price retracing sharply back towards the $12-$13 range. This level represented the initial significant support established in the first few trading sessions immediately following its IPO. Such dramatic price swings, both upward and downward, are not uncommon in the speculative environment surrounding recent IPOs.
The Spark: Our analysis focused on the price action as BULL approached this $12-$13 support zone. A key observation was the noticeable drying up of selling volume during the second leg of its decline. This diminution of volume as the stock neared a potential support level can often indicate waning selling pressure and potential seller exhaustion. On the day the position was initiated, the particularly low trading volume further suggested that the aggressive selling phase might be nearing its conclusion, potentially setting the stage for a technical bounce.
The Journey: Following our entry, BULL initially traded higher on the subsequent day, suggesting a possible validation of the support level. However, this early strength proved transient as the stock reversed course intraday, eroding the initial gains. Prioritizing capital preservation in a volatile and uncertain setup, the decision was made to close the position near the breakeven point.
The Conclusion:
In retrospect, this trade suffered from an insufficiently defined strategic objective. There was ambiguity regarding whether the position was intended as a short-term day trade, a multi-day swing trade, or a speculative entry into a potentially explosive name. This lack of a clear thesis and pre-defined parameters for success and failure ultimately made effective trade management challenging. Consequently, given the inherent risks and the unclear strategic rationale, this particular trading opportunity might have been best avoided altogether.
TRADE #6: LASR - Pennant
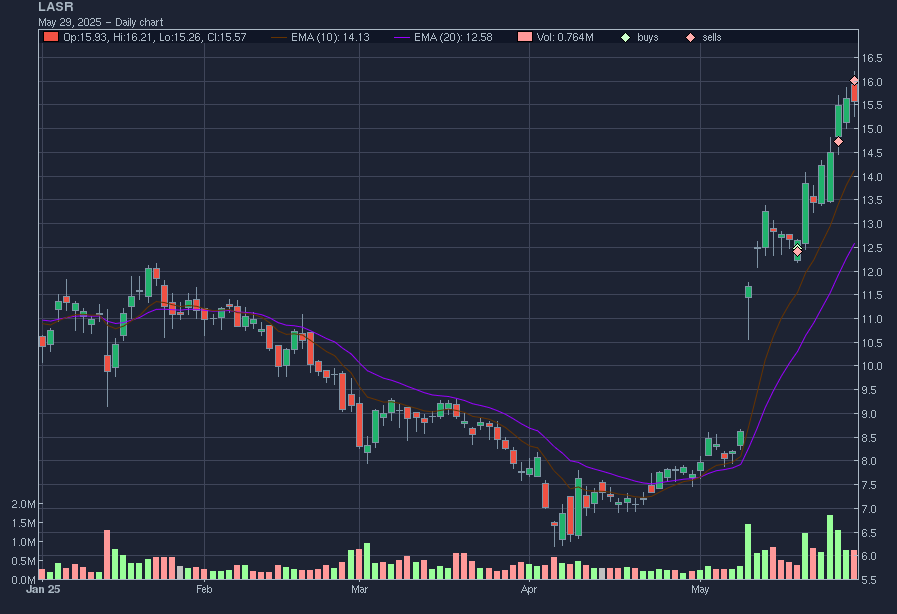
The Scene: nLight Inc. (LASR) reported robust earnings, significantly exceeding consensus estimates and highlighting a strengthening project pipeline across domestic and international markets. This fundamental catalyst was amplified by favorable technical characteristics: the stock possesses a relatively low float of approximately 45 million shares, and the trading session immediately following the earnings release saw a surge in volume, reaching levels not observed in the preceding four to five months. This combination often signals strong institutional interest.
The Spark: After an initial three-day advance post-earnings, nLight entered a period of constructive consolidation. Price action during this phase was characterized by candlesticks with prominent lower wicks, suggesting persistent buying interest on any intraday weakness, indicative of accumulation. Over several days, trading volume progressively declined within this consolidation, a common precursor to a potential continuation move as supply appears to be absorbed. This led to an entry near the $12.50 level, anticipating an upward breakout from the consolidation pattern. This trade idea was consistent with our prior identification of nLight as a candidate on our weekly watchlist. The initial stop-loss was strategically placed below the consolidation range and a prior gap support, specifically beneath the $12.00 level.
The Journey: An initial execution error (a "fat finger" trade) necessitated an immediate partial reduction of the position on the entry day. Subsequently, the correctly sized remaining position was allowed to participate in the anticipated second leg of the upward move. As the stock advanced, profits were systematically taken: partial sales were executed at the $14.50 level and again at $16.00. Currently, approximately 50% of the original position remains in the portfolio. The intention is to manage this portion using key short-term moving averages (e.g., the 10-day and 20-day) as dynamic stop-loss points, allowing for participation in further upside while protecting accrued gains. Future opportunities to rebuild or add to the position will be evaluated based on evolving price action and technical setups.
The Conclusion:
This engagement with nLight stands out as one of the more successful trades for the month, characterized by effective management of a fundamentally strong setup. The strategy of entering during a low-volume consolidation following a high-volume earnings reaction, coupled with disciplined profit-taking, proved sound. The primary operational learning point centers on the critical importance of meticulous execution during order entry to prevent potentially costly "fat finger" errors, which, while managed in this instance, can otherwise detract from an otherwise well-conceived trade.
TRADE #7 LEU - Pennant
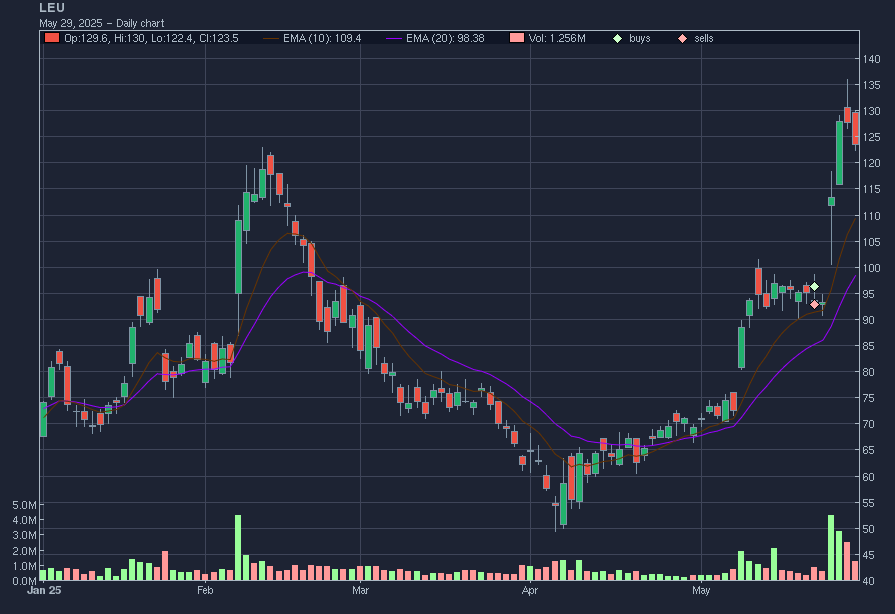
The Scene: Centrus Energy Corp (LEU), a company with which we have historical familiarity, appeared on our weekend scans, presenting a compelling technical setup. The stock had been in a steady uptrend since April, a move further catalyzed by a strong earnings report that propelled its value upwards by over 20%. Following this surge, LEU entered a period of consolidation, forming a classic "bull flag" pattern on notably low trading volume, a pattern often indicative of a potential continuation of the prevailing uptrend.
The Spark: Within this flag formation, two distinct intraday sell-offs were observed, both of which were aggressively bought, resulting in the formation of "hammer" candlestick patterns by the close of each respective day. Significantly, one of these hammers found precise support at the rising 10-day exponential moving average (10 EMA). All of this price action occurred on very low volume, suggesting that selling pressure was limited and buyers were stepping in at key technical levels. Based on these observations, an entry was initiated upon the stock breaking above the $95.00 resistance level, which was perceived as the upper boundary of the consolidation.
The Journey: This engagement proved to be exceptionally short-lived, lasting less than 24 hours. The anticipated breakout above $95.00 failed to sustain momentum; instead, the price reversed, and broader market sentiment appeared to be weakening concurrently. Rather than waiting for the pre-defined stop-loss order (placed below $90.00) to be triggered, a proactive decision was made to exit the position with a partial loss to mitigate further downside risk in a rapidly deteriorating setup.
The Conclusion:
This trade ranks among the less successful engagements of the month. A more patient approach might have involved adhering to the original stop-loss or perhaps closing only a portion of the position on the initial signs of weakness. The decision to exit fully proved particularly unfortunate in hindsight. Just two days after our exit, news emerged that President Donald Trump signed executive orders aimed at revitalizing the U.S. nuclear power industry, including measures to expedite the deployment of new reactors. This development acted as a significant catalyst for LEU, with the stock subsequently surging over 30% from our original entry point. This outcome serves as a stark reminder of the unpredictable nature of market-moving news and the inherent challenges of short-term trading – a quintessential "that's trading" scenario.
TRADE #8: STNE - Flag
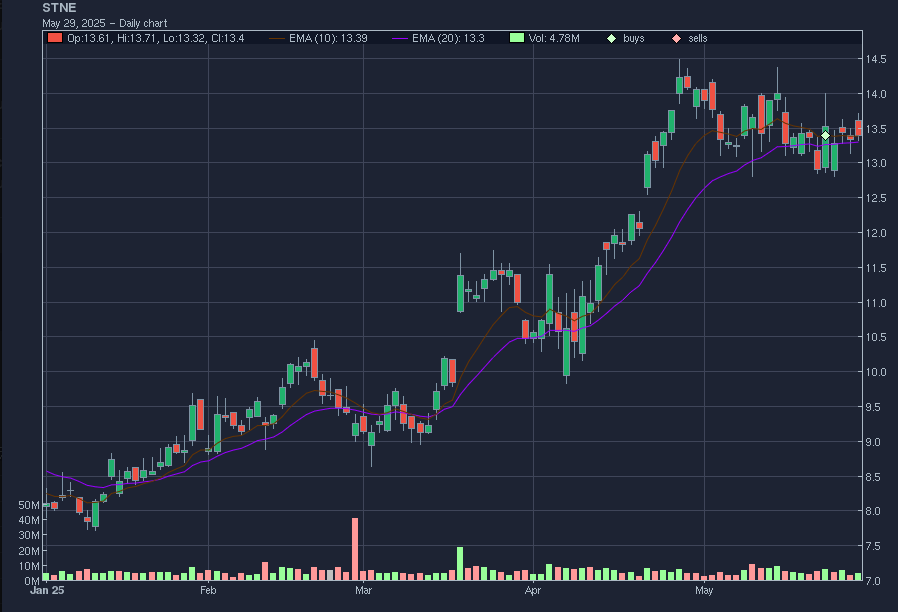
The Scene: StoneCo Ltd. (STNE) had distinguished itself as a top-performing equity in early 2025, exhibiting significant price appreciation. Our interest in the company was further heightened by concurrent research into the Brazilian fintech sector for an upcoming article, which provided us with a robust understanding of STNE's market position and growth potential. Technically, after a substantial 50% rally in April, STNE entered a consolidation phase, forming a "flag" pattern. The $13.00 level emerged as a critical support zone during this period, having been tested successfully on multiple occasions, with buyers consistently stepping in to defend it.
The Spark: The entry trigger materialized when STNE broke out of this flag pattern to the upside, accompanied by a notable increase in trading volume. This combination of a pattern breakout and strong volume is often a bullish indicator, suggesting conviction behind the move. A position was initiated upon this breakout, with a protective stop-loss order placed beneath the key $13.00 support level, aligning with the bottom of the consolidation range.
The Journey: Drawing lessons from a recent experience with the LEU trade, a deliberate decision was made to adhere strictly to the pre-defined stop-loss for STNE. The position remains active, currently holding a modest unrealized profit. The strategy is to maintain the holding unless the stop-loss level is breached or there is a significant deterioration in either the broader market's fundamental outlook or STNE's specific technical picture.
The Conclusion:
At present, the STNE trade is ongoing and being managed following our initial strategy and risk parameters. Further commentary will be reserved pending future price developments and any adjustments to the position.
TRADE #9: ECX - Pennant
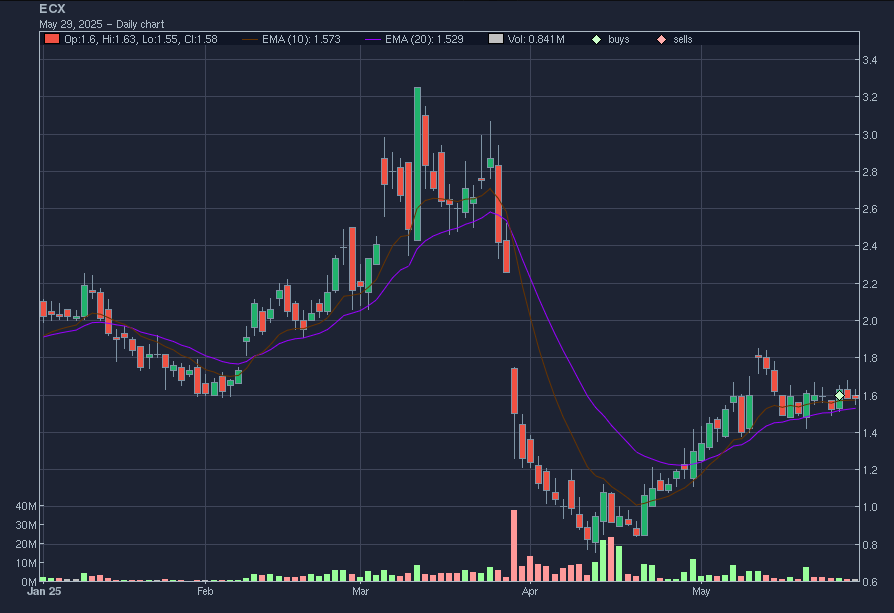
The Scene: After a public offering in April sent its shares tumbling, this automotive tech company staged a remarkable comeback, with its stock price doubling from the lows. The firm, specializing in cutting-edge digital cockpits for the burgeoning electric vehicle market, caught our eye. We saw a compelling narrative: as cars increasingly become computers on wheels, the demand for sophisticated, integrated digital interfaces is set to soar. Following its impressive rally, the stock entered a period of consolidation, hovering steadily above its 20-day exponential moving average – a sign that buyers were holding firm after the sharp ascent.
The Spark: Intrigued by its recovery and promising business model, we added the company to our internal watchlist. Our weekly briefing delved deeper, examining the fundamentals to ascertain if this was a genuine turnaround story or a fleeting bounce. After about ten days of unusually light trading volume, a classic calm before a potential storm, the stock showed signs of life. On the first day it began to break out from this quiet consolidation, we initiated a position. Our risk was clearly defined: a stop-loss order placed just below the recent lows of this consolidation range, offering a tight leash on potential downside.
The Journey: We are currently holding this position, patiently anticipating a more significant breakout. The initial move was encouraging, but the stock has yet to deliver the explosive follow-through that often characterizes major trend continuations. We remain watchful, monitoring volume and price action for clues to the next leg of its journey.
The Conclusion:
It's still early days for this trade, so a full post-mortem is premature. In hindsight, the consolidation period wasn't exceptionally long by our usual standards. We often aim to enter slightly ahead of a confirmed breakout to secure a better average price. In this instance, perhaps a little more patience before committing capital might have been the optimal play, allowing the consolidation to mature further. Nevertheless, we are comfortable with our current position. The risk was well-managed from the outset, and the story behind the company remains compelling. We're positioned for potential upside with a clearly defined and limited downside.
TRADE #10: MBOT - Ascending Triangle
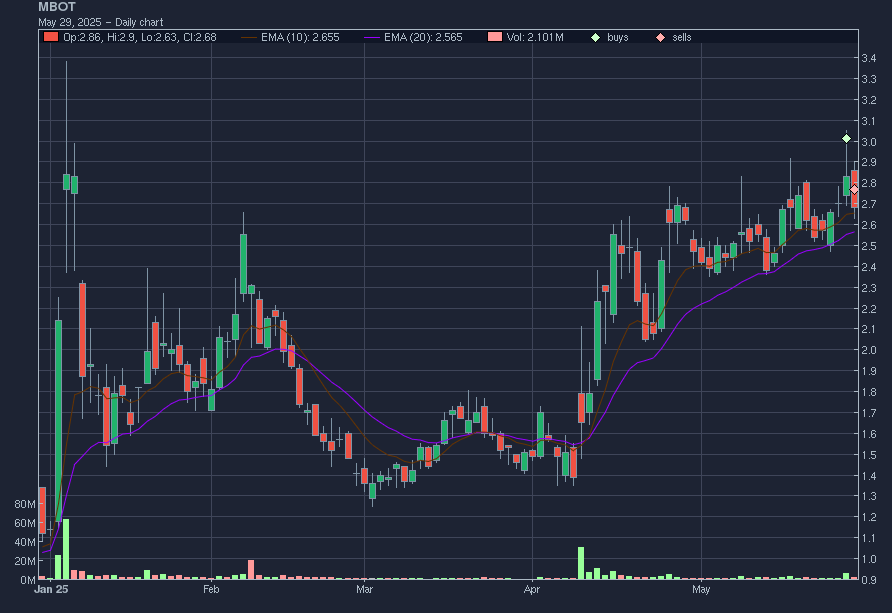
The Scene: This robotic medical device company captured our attention in April. The catalyst was significant: on April 9th, Microbot Medical Inc. (NASDAQ: MBOT) unveiled compelling clinical data for its Liberty Endovascular Robotic Surgical System. The results were impressive – 100% success in robotic navigation and a striking 92% reduction in radiation exposure, all without any reported adverse events. This news acted as a powerful propellant, sending the stock surging. In classic technical fashion, the price action carved out what chart-watchers call a "cup" formation, and subsequently began to build a "handle" – a consolidation pattern that often precedes a further upward move. A critical price point, $2.90, had been a notable area of activity since early January, marking the launchpad for a previous significant rally.
The Spark: As the stock began to nudge above that key $2.90 threshold, we moved decisively. Our experience with these types of high-momentum, news-driven stocks, particularly in the speculative biotech and medical device space, has taught us that speed is often of the essence. These "high flyers" can ignite, posting gains of 20% or more in mere minutes. To secure a favorable entry price before a potential surge, a swift execution was paramount.
The Journey: Our engagement with this stock, however, proved to be a brief affair. On the very same day we entered, we observed signs that the breakout above $2.90 was faltering. While initial failures can sometimes be a "shakeout" – a quick dip designed to scare off weaker hands before the real move (often called a "squat" in trading parlance) – we remained vigilant. We gave it another day, hoping to see renewed strength. When the stock failed to recover and confirm the breakout on the subsequent trading day, we made the call.
The Conclusion:
In retrospect, this trade underscores a familiar tension. While a little more patience before entering might have allowed for a clearer confirmation of the breakout, the nature of these volatile names often demands quick action to avoid missing the initial, powerful thrust. What's crucial, however, is decisiveness on the exit. We didn't hesitate to cut the position when the evidence suggested the immediate bullish thesis was not playing out.
TRADE #11: PEP - Double Bottom
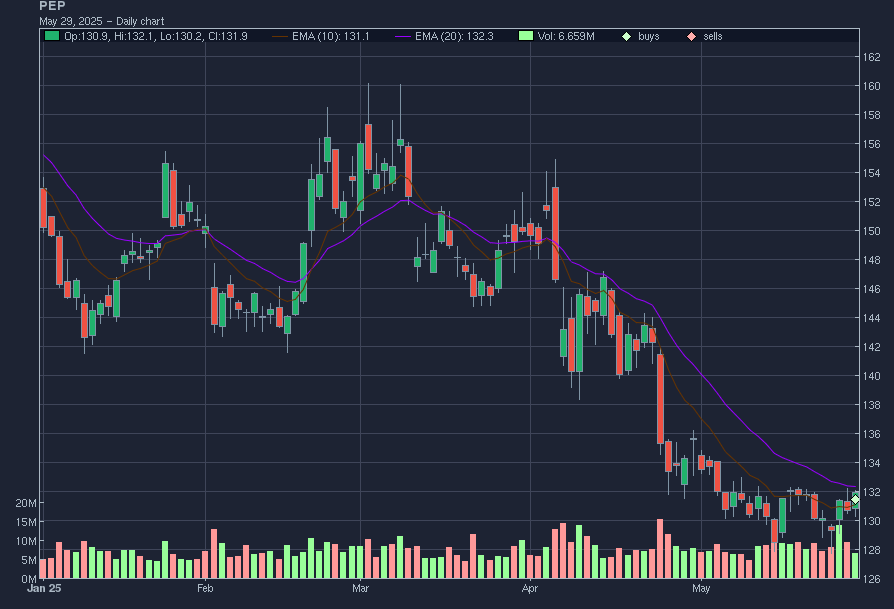
The Scene: PepsiCo, a titan of the consumer staples world and a household name, had been on a downward trajectory since 2023. On the long-term monthly chart, the $128 level emerged as a significant support zone that appeared to be holding firm. Reinforcing this, the daily chart revealed a "double bottom" pattern – a classic technical signal often indicating that selling pressure is exhausted and a potential reversal is brewing. Simultaneously, the broader market was showing signs of consolidation, with the very real possibility of a steeper pullback looming. Given our portfolio's existing concentration in growth and technology-oriented stocks, the strategic appeal of adding a more defensive name like PepsiCo became clear. The technical setup looked promising, the risk/reward seemed favorable, and it offered a valuable hedge against potential market weakness.
The Spark: We are currently holding this position in PepsiCo. The trade is still in its early stages, and we are monitoring its development against our initial expectations and the broader market environment.
The Journey: The subsequent price action was remarkably smooth and bullish. SEZL exhibited consistent upward momentum, trending higher on most trading days following the initial gap. This type of sustained follow-through buying is characteristic of the most powerful Episodic Pivots (EPs), where institutional demand often builds over time. We strategically took partial profits by selling a portion of our holding near recent highs to lock in gains, while retaining over 50% of the initial position to participate in further potential upside. Regrettably, the initial conservative position sizing means the remaining holding, while profitable, is relatively small in absolute terms.
The Conclusion:
As this is the newest addition to our portfolio, a comprehensive conclusion is premature. The initial thesis – a technically sound entry in a defensive blue-chip, offering a hedge during potential market turbulence – remains intact. We've established our position based on a confluence of supportive technical signals and a strategic portfolio consideration. Time will tell how this defensive play unfolds, but the initial setup provided a compelling rationale for engagement.

Disclaimer: This analysis is for informational purposes only and should not be considered financial advice. Always conduct your research and consult with a licensed financial advisor before making investment decisions.