
Wall Street Radar Vol. 19: Stocks to Watch
Volume 19: Inflation Fears Rattle Markets Ahead of Fed Decision
Based on our comprehensive analysis of market health indicators, the current technical backdrop reveals a distinctly bifurcated market environment. The major equity indices' performance masks an underlying divergence between market segments.
The market is split into two contrasting narratives: Large-cap and technology stocks continue to lead and drive major index gains, while small and mid-capitalization segments show significant deterioration. This divergence has become more pronounced, raising concerns about the market's overall health and breadth.
This week's trading pattern further emphasizes this disparity, with only a select few sectors and stocks posting meaningful gains, while the broader market and majority of equities continue to experience declining valuations. This narrow leadership suggests potential vulnerability in the current market structure.
Looking ahead, next week will be pivotal as important economic data releases could determine the possibility of a traditional "Santa Claus rally" through year-end.
(please check our Market Monitor for additional information)
A Note to Our Valued Readers
As the holiday season approaches, we want to thank you for your continued support and appreciation of our watchlist. We’ve poured countless hours into creating this resource, and it’s been heartwarming to see how much it’s valued by so many of you.
However, despite its popularity, only one person has supported us with a donation. To keep this resource free for everyone, we need your help. This Christmas, we’re asking for your generosity—if you’ve found our work helpful, please consider supporting us by "Buying us 1 or more coffees."
Your contribution, no matter how small, can make a big difference.
With enough support, we can continue to provide the watchlist completely free for everyone in 2025.
Thank you for helping us keep this resource alive and accessible to all.
T2118
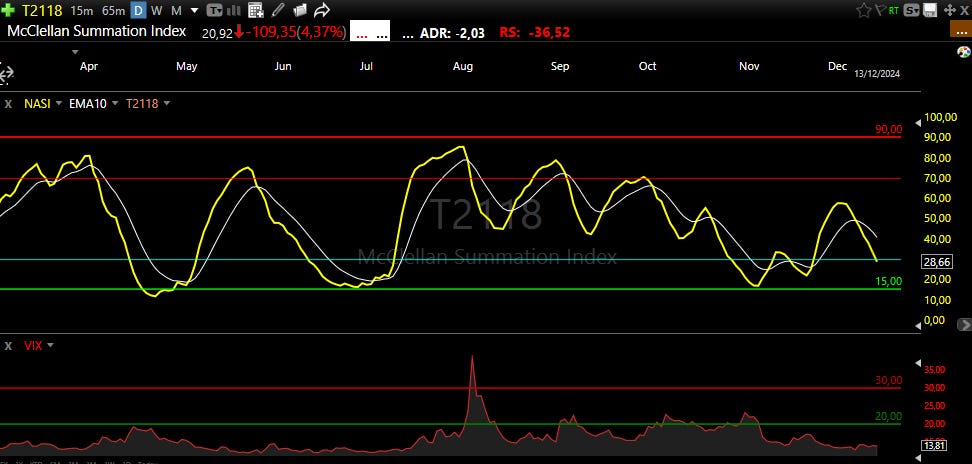
The T2118 index has broken below its 10-day exponential moving average and has entered oversold territory, currently reading 28.66. The current oversold reading suggests the potential for a technical bounce in the near term.
Historical context provides an important perspective: During January's market weakness, the indicator found support just below the 30 level. However, in more recent periods, the T2118 has typically continued declining until reaching the 15-18 range before establishing a bottom. This historical pattern merits close attention when evaluating current market conditions.
T2108
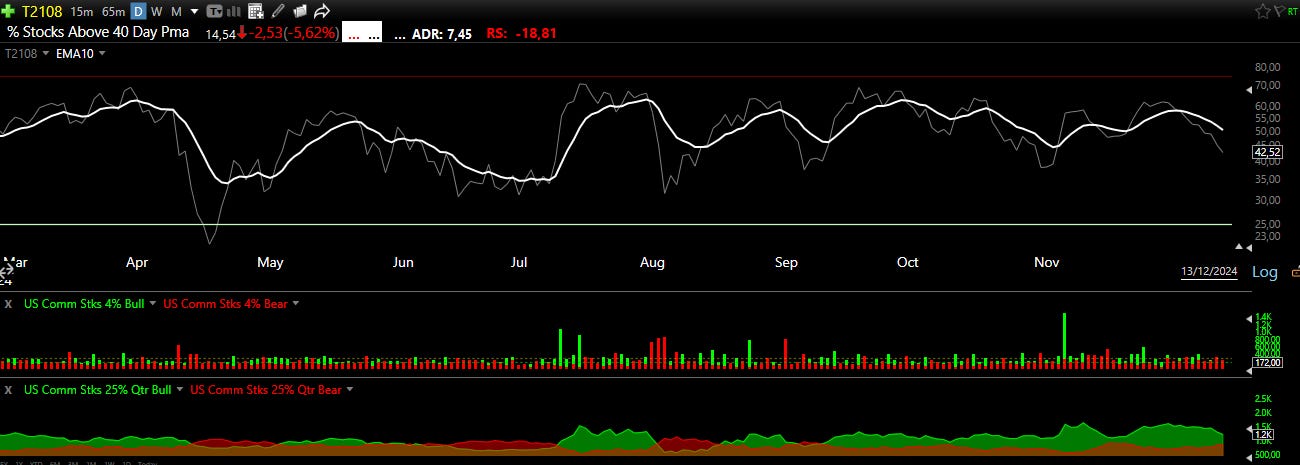
Recent market analysis reveals a clear technical picture as T2108 remains firmly positioned below its 10 EMA at 42.52, reflecting persistent bearish pressure across most sectors throughout the past week. The daily trading patterns (4% Bull-Bear) consistently demonstrate bear dominance, indicating sustained selling pressure in the short term.
The longer-term perspective, as evidenced by the 25% quarterly indicator, provides a more constructive outlook. While this metric suggests we're experiencing a pullback, it continues to signal robust underlying market strength, remaining firmly in positive territory. This divergence between short-term weakness and longer-term stability suggests the current market action may represent a healthy consolidation phase rather than the beginning of a more significant downward trend.
Portfolio updates and new positions:

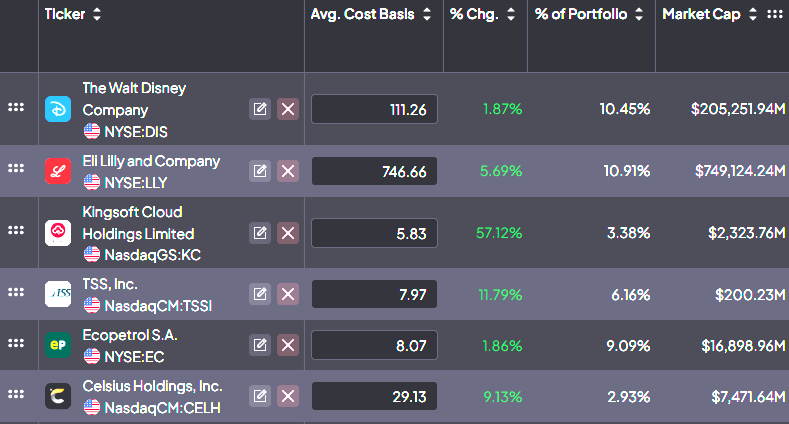
⚡ AI-optimized, human-verified: Our expert team carefully selected Premium market intelligence from Finchat's data. Explore now →
🎢 High-Volatility Thrill Rides
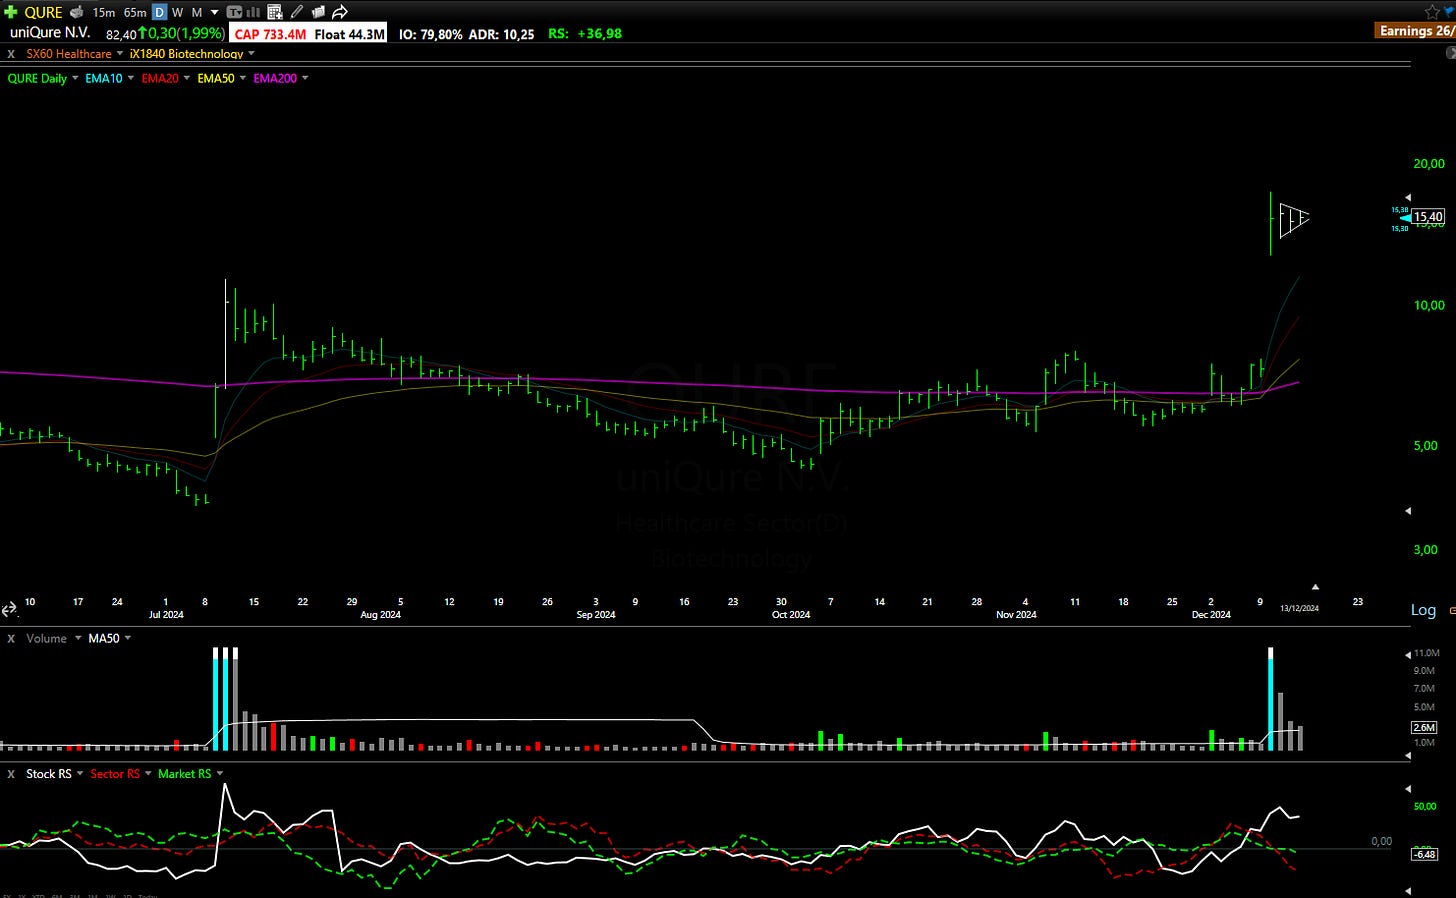
QURE: UniQure
What they do: Gene therapy company focused on rare diseases.
Why watch? 🧬 UniQure stock doubled after reaching a testing agreement with the FDA for its Huntington's disease treatment. The stock is now consolidating on low volume, indicating it may need a few more days to stabilize. However, a breakout above $16 could present an opportunity for a starter position.
KULR: KULR Technology Group
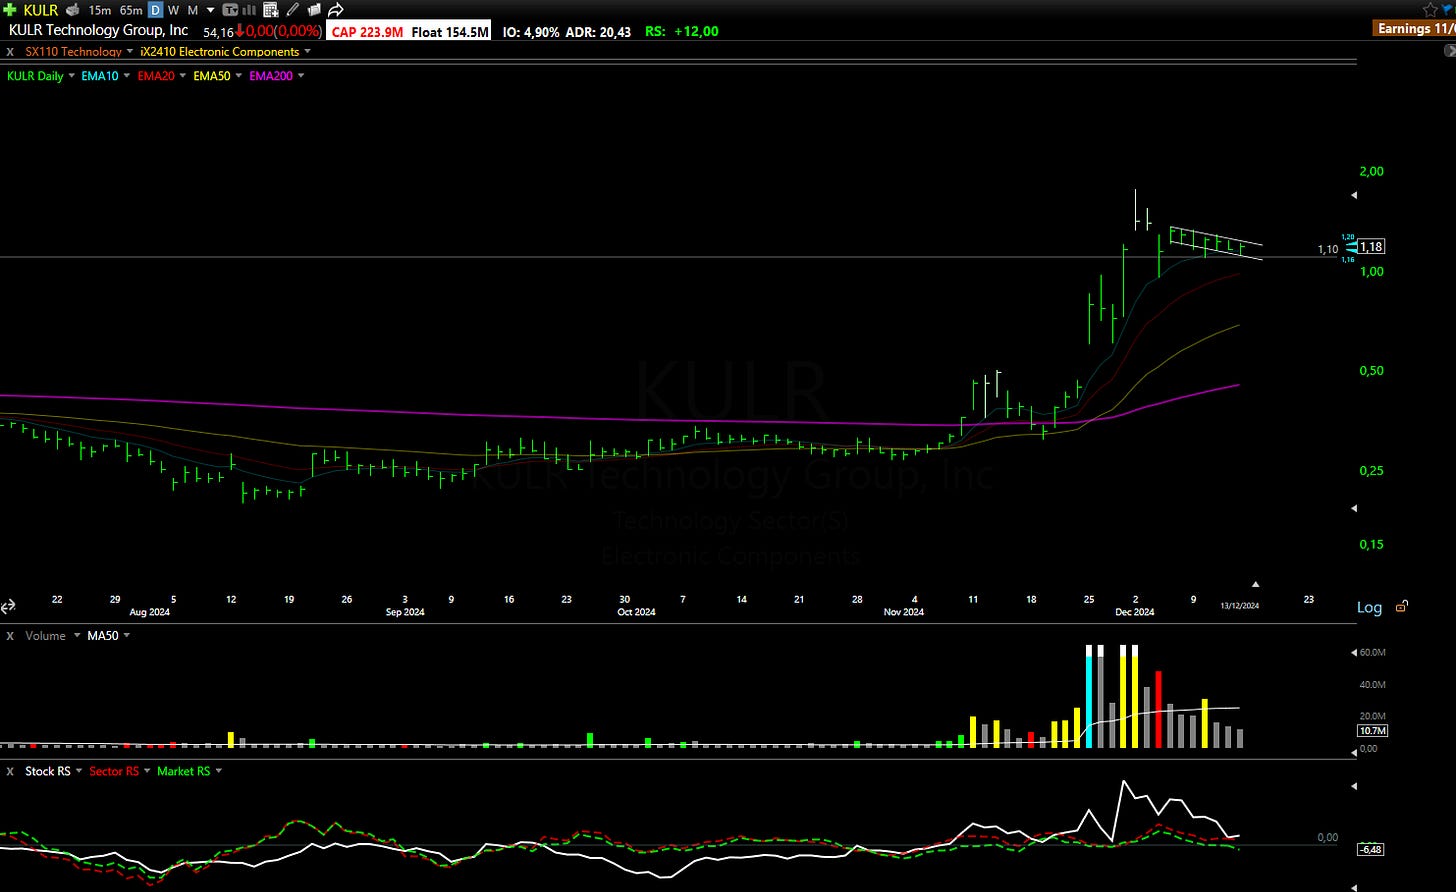
What they do: Developer of thermal management and battery safety solutions.
Why watch? 🔋 After being awarded a U.S. Navy contract to develop high-temperature internal short circuit cells, KULR surged 190% in one week. The stock is now forming a bullish flag pattern on low volume, with the 10 EMA catching up. A breakout above the $1.10 key weekly level could signal the next move higher.
LX: LexinFintech Holdings Ltd
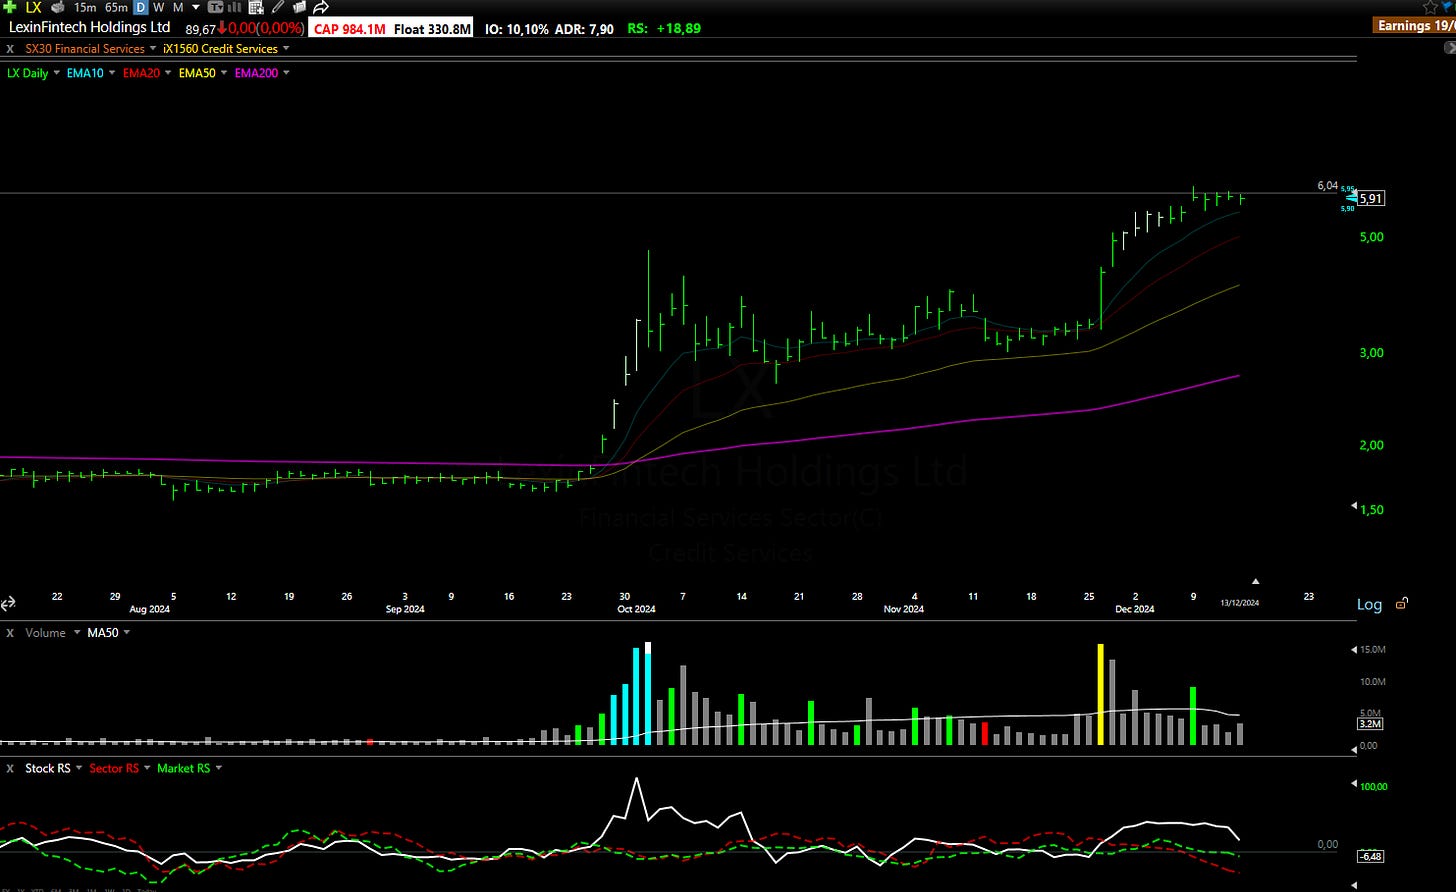
What they do: Chinese fintech company providing consumer credit services.
Why watch? 🇨🇳 LX is one of the strongest Chinese stocks alongside KC. If the Chinese market rebounds, LX could break above $6 and begin a new upward leg.
🏄♂️ Medium-Risk Wave Riders
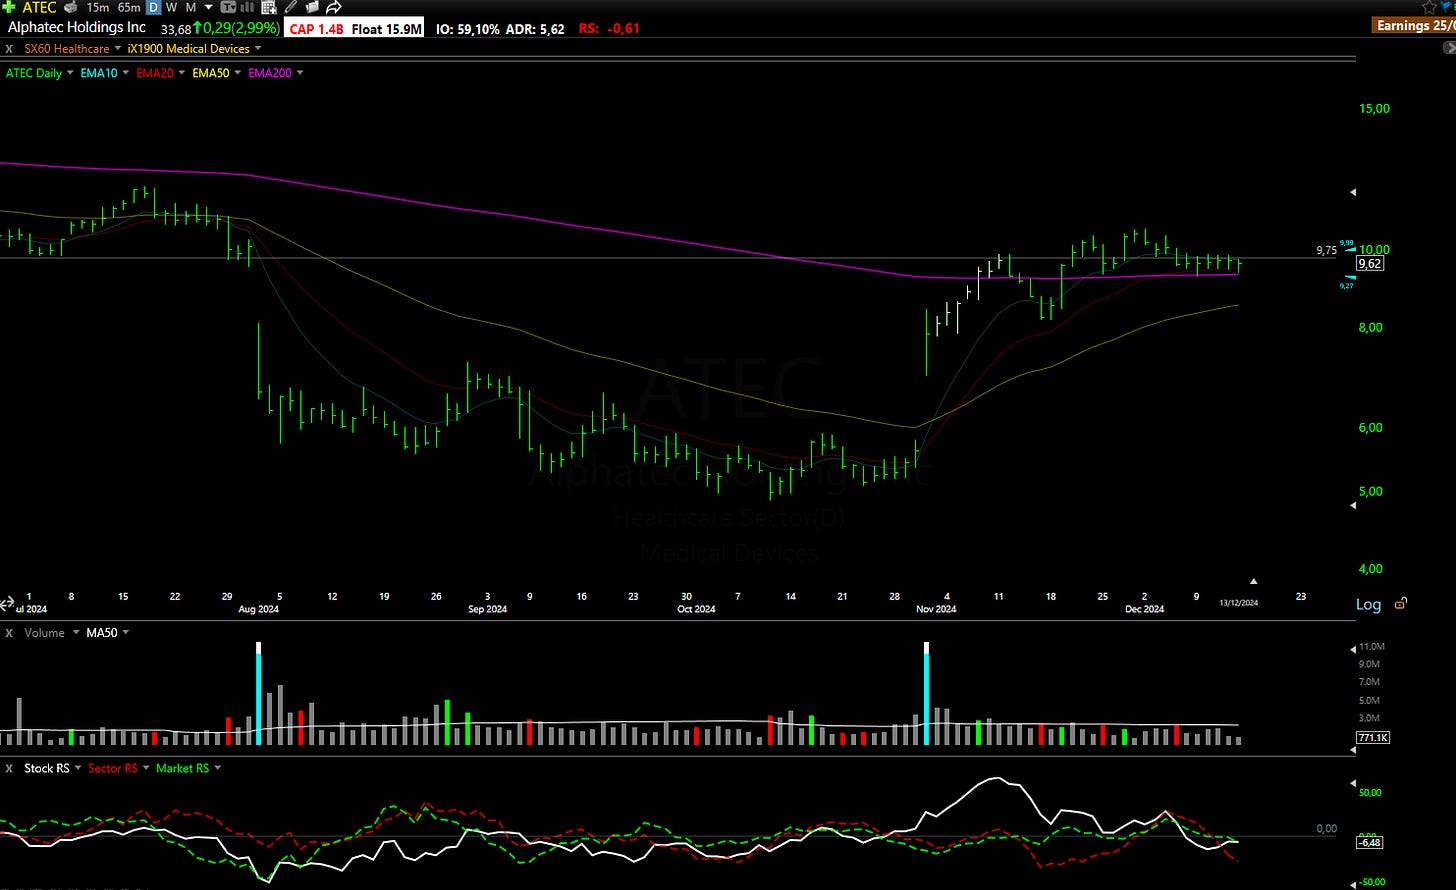
ATEC: Alphatec Holdings Inc
What they do: Medical technology company specializing in spine surgery solutions.
Why watch? 🦴 Strong earnings in October, with higher revenue and reduced cash burn, have set the stage for a bullish setup. The stock is consolidating on low volume below the $9.75 key weekly level, supported by the 10, 20, and 200 EMAs.
ASAN: Asana Inc
What they do: Work management software company.
Why watch? 📈 Asana surged 45% after delivering strong quarterly results, marking its largest daily percentage gain on record. The stock is consolidating below the $25 key weekly level on low volume. While slightly extended, a breakout above $25 could trigger a new leg higher.

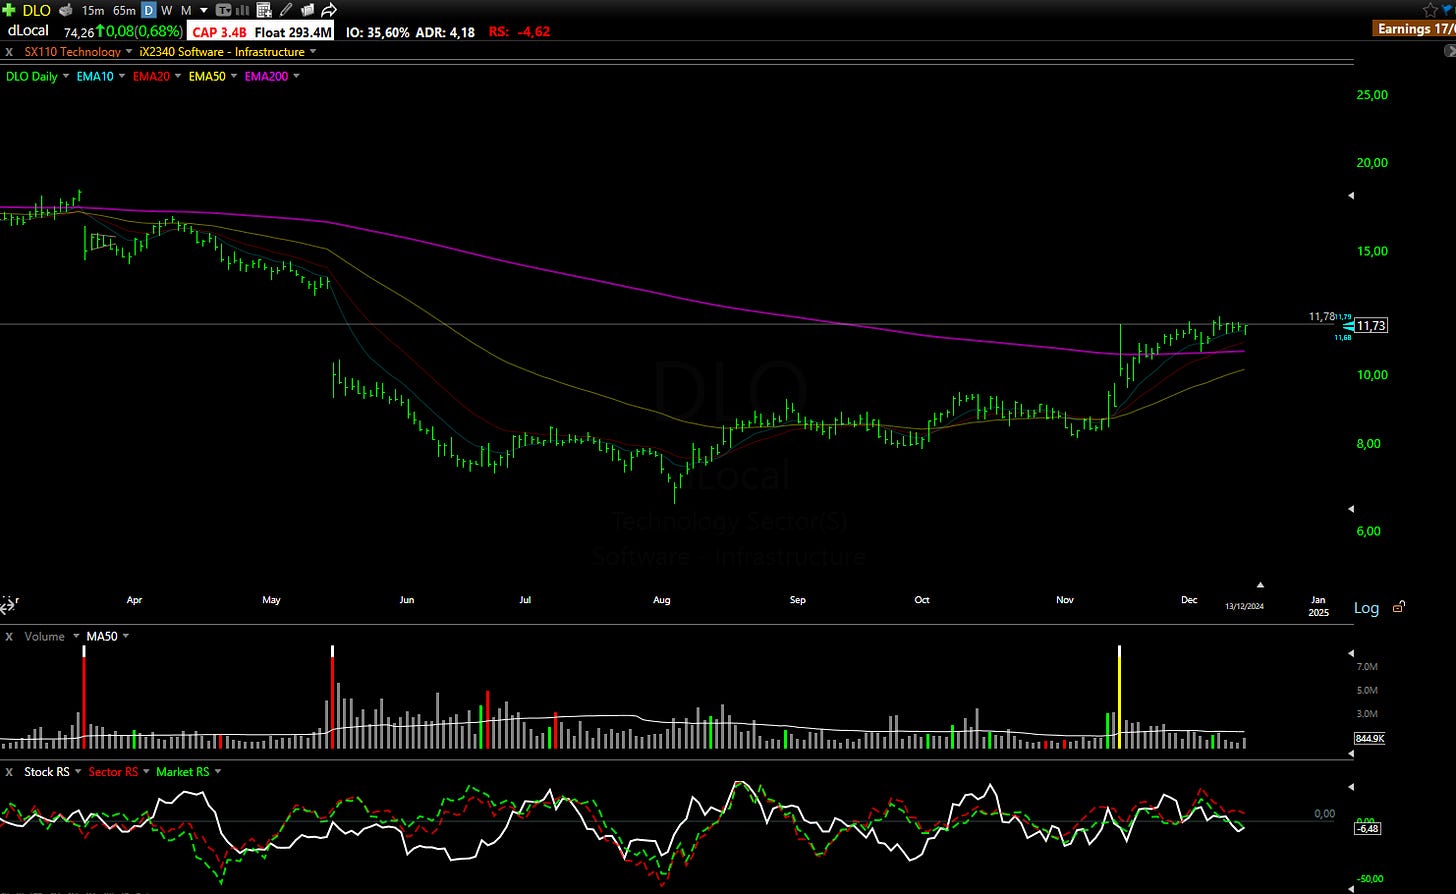
DLO: DLocal Ltd
What they do: Payment platform for emerging markets.
Why watch? 💳 Debt-free and amid a turnaround, DLO presents a compelling long-term hold. Technically, the stock is forming a large cup-and-handle pattern across multiple timeframes. The $11.72–$12.00 range is a critical breakout zone.
ATLC: Atlanticus Holdings Corp
What they do: Financial services company specializing in consumer credit.
Why watch? 💵 After a 68% surge following November earnings, ATLC is now pausing for the first time, supported by the 10 EMA. This consolidation could set the stage for another leg higher.

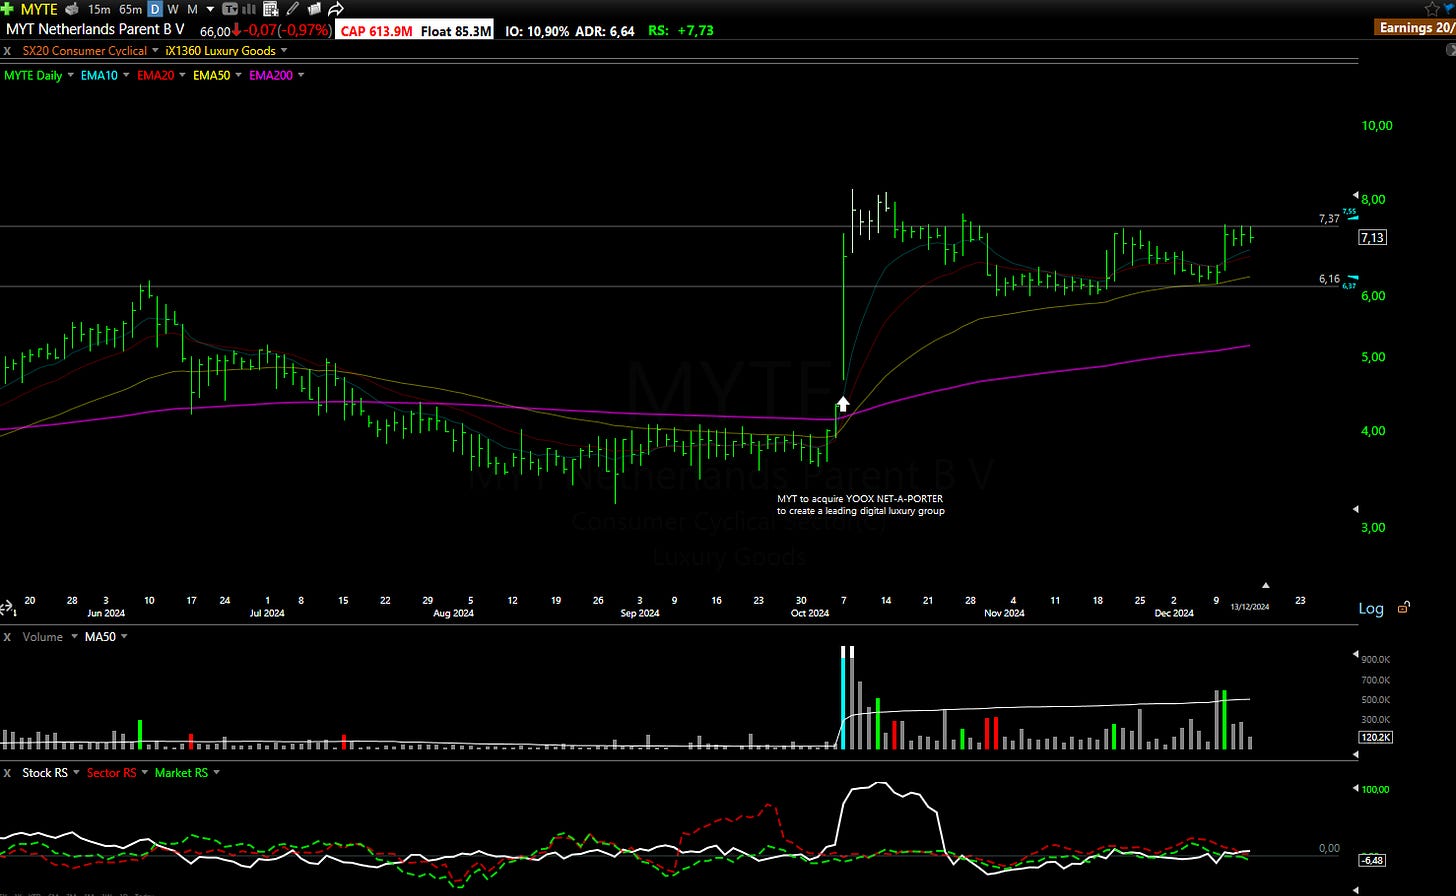
MYTE: MYT Netherlands Parent BV
What they do: Luxury fashion e-commerce platform.
Why watch? 👗 MYTE has been range-bound since October, trading within a box between $6 (support) and $7–$7.50 (resistance). A breakout above $7.50 could lead to a significant upside.
🛡️ Low-Risk Safe Harbors
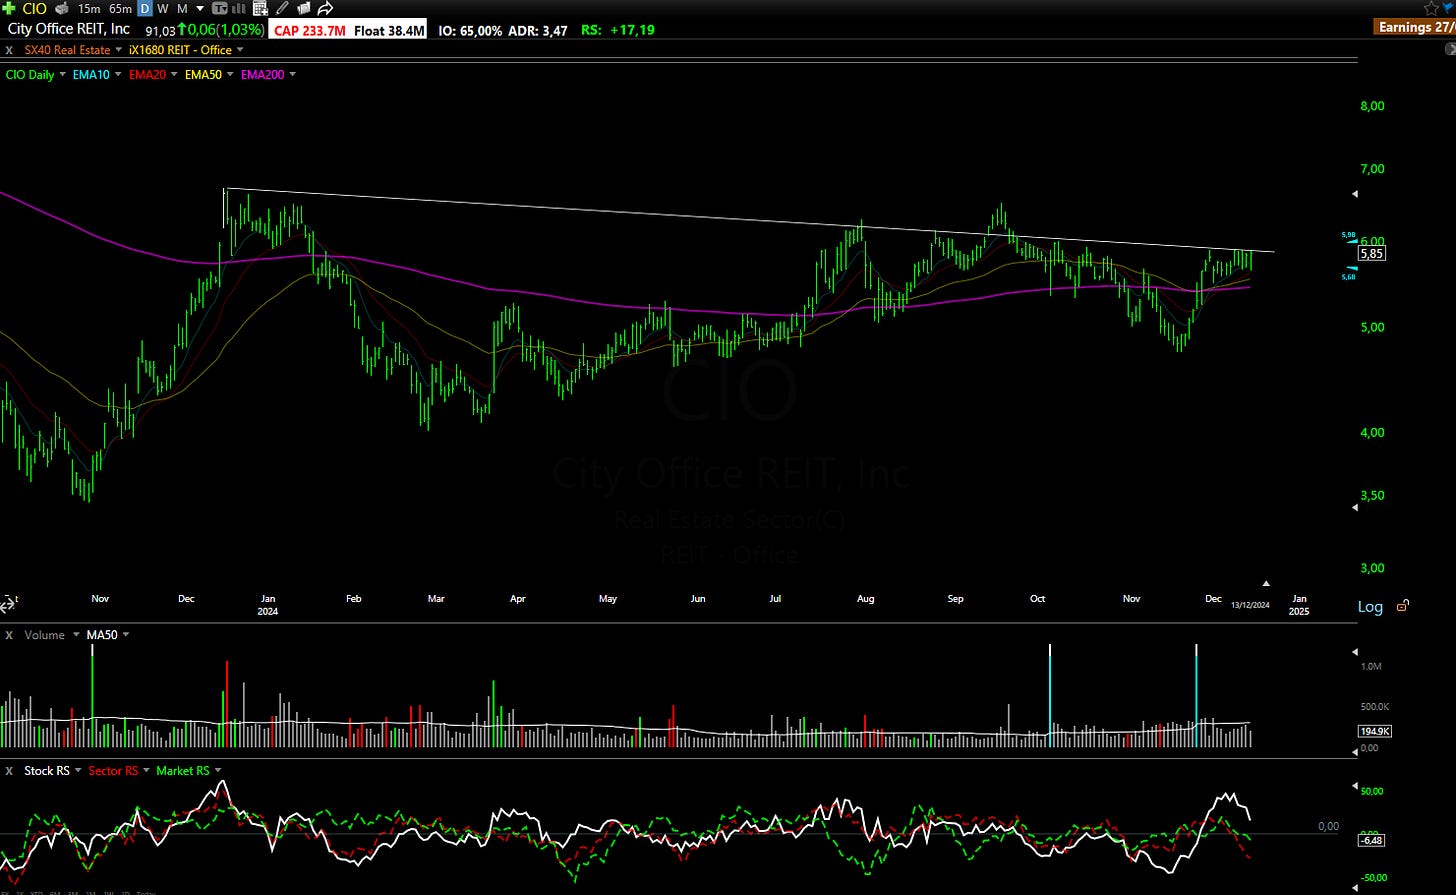
CIO: City Office REIT Inc
What they do: Real estate investment trusts focused on office properties.
Why watch? 🏢 CIO is forming a large symmetrical triangle across daily, weekly, and monthly charts. Additionally, a cup-and-handle pattern is developing on the daily chart, signaling the potential for a breakout.
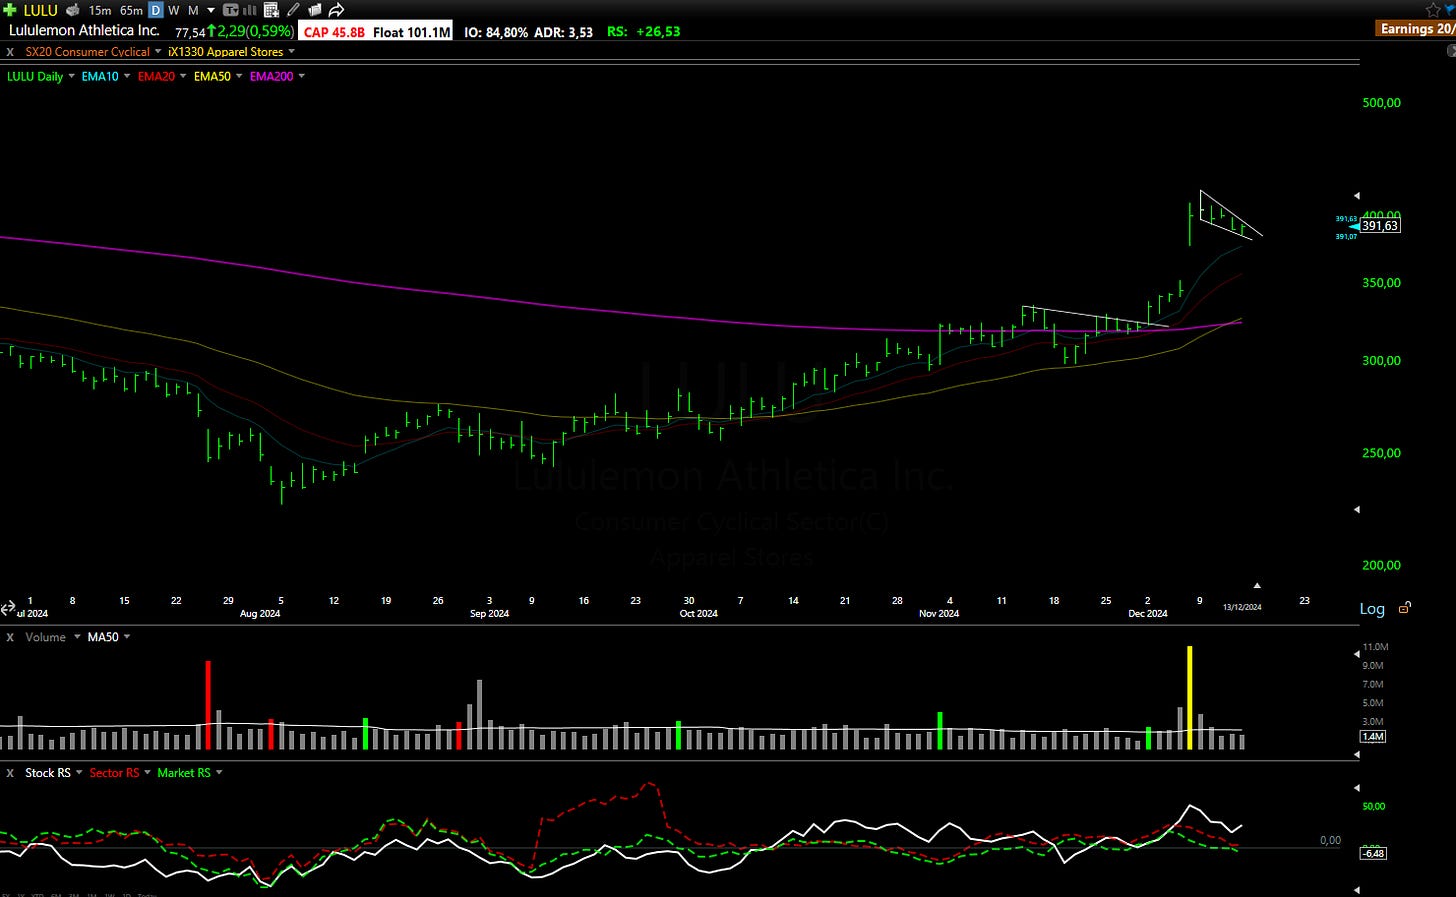
LULU: Lululemon Athletica Inc
What they do: Athletic apparel retailer.
Why watch? 🧘 Lululemon shares jumped after beating Q3 earnings expectations and raising its full-year outlook. Analysts highlight growth potential in both U.S. and international markets, particularly in China. The stock is forming a falling wedge on low volume, with the 10 EMA catching up, suggesting it may be ready for its next move higher.
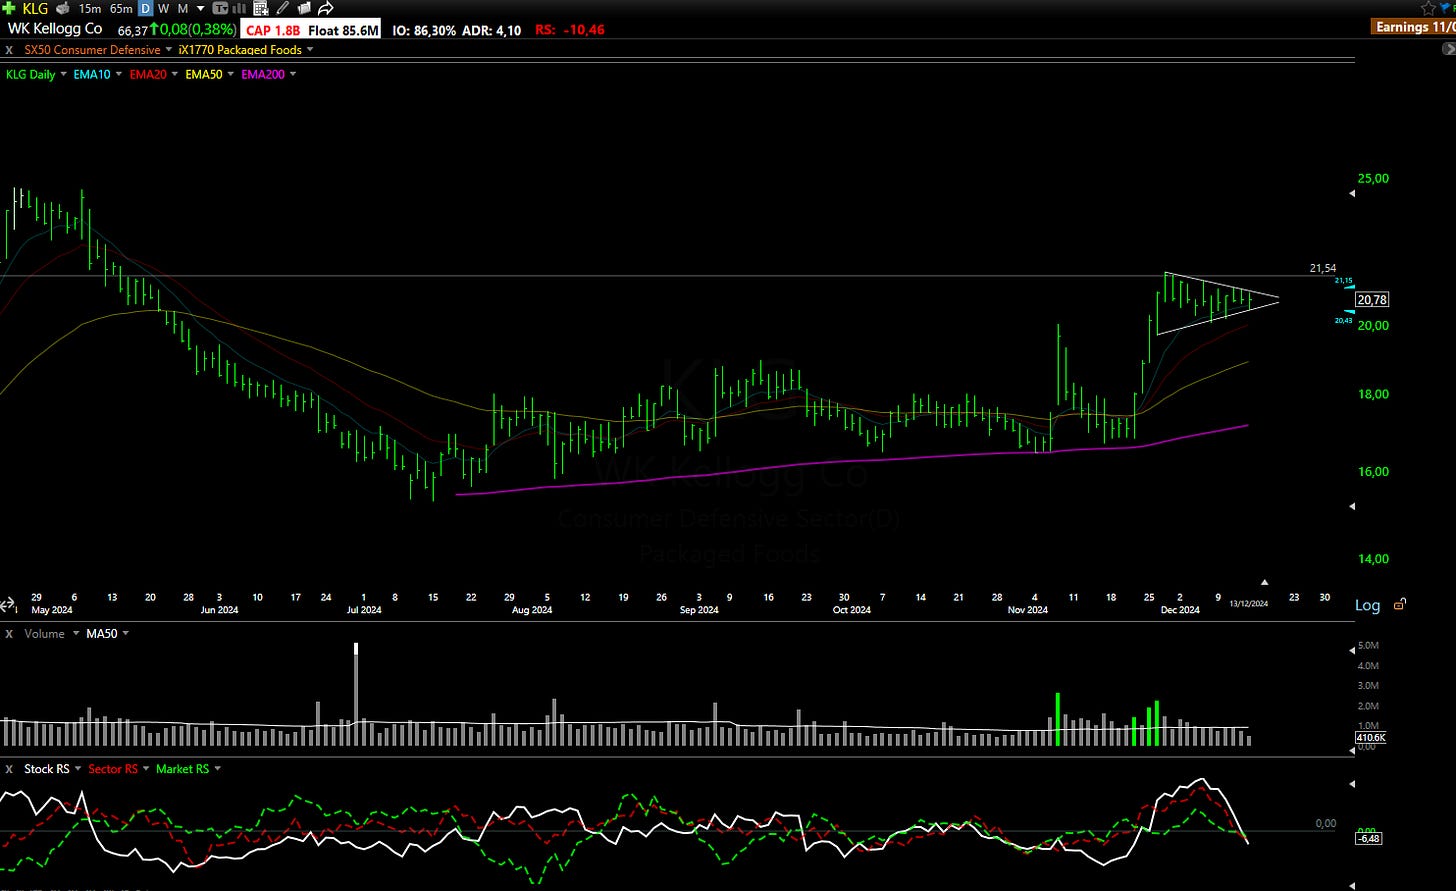
KLG: WK Kellogg Co
What they do: Food manufacturing company.
Why watch? 🥣 WK Kellogg exceeded quarterly sales expectations and raised its outlook, driving shares higher in November. The stock is now consolidating on declining volume, forming a bullish flag that could lead to a breakout soon.
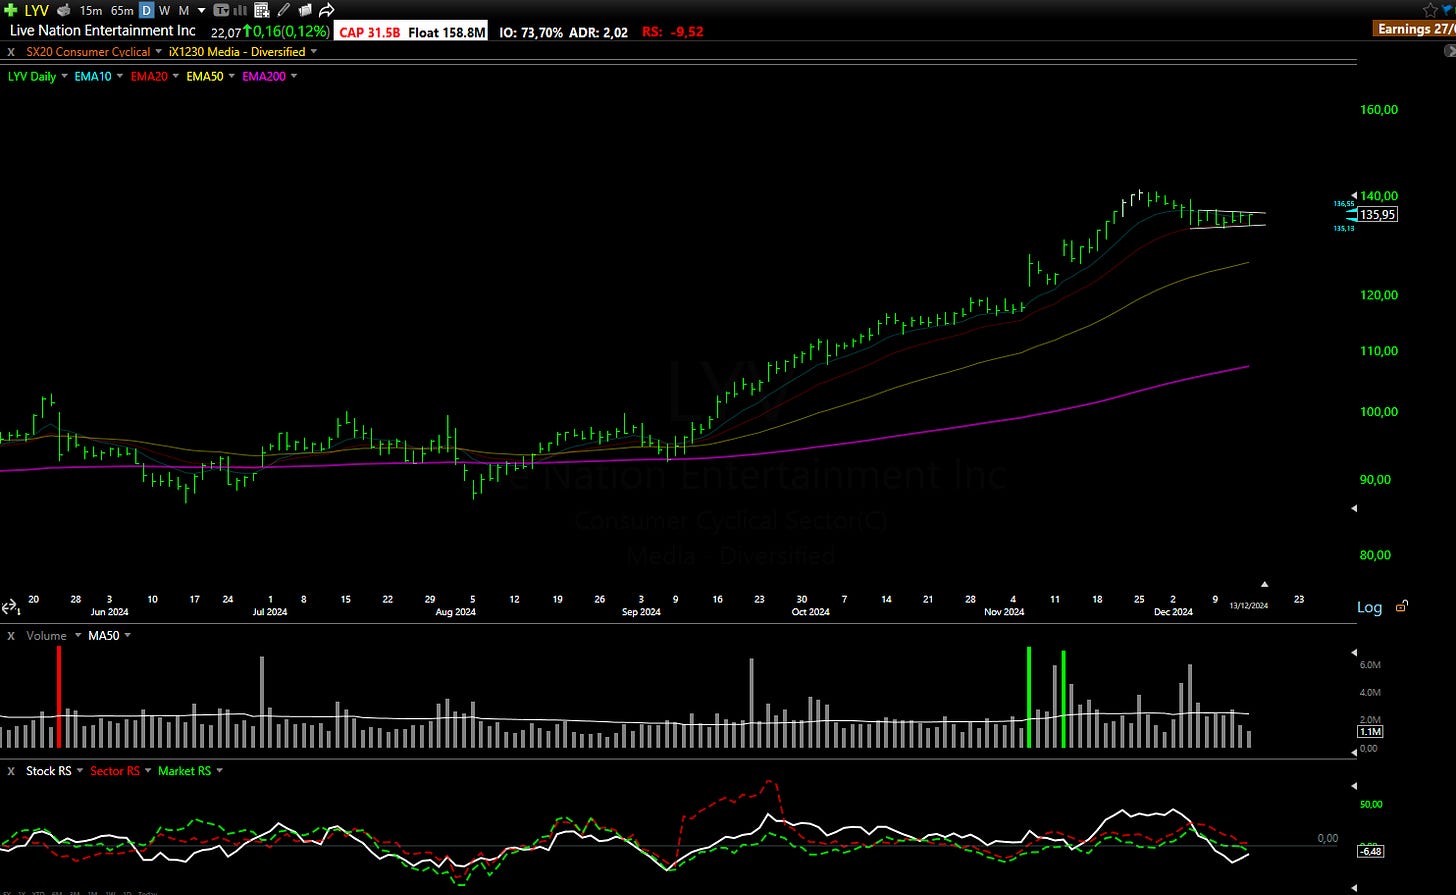
LYV: Live Nation Entertainment Inc
What they do: Live entertainment and ticketing company.
Why watch? 🎶 LYV has gained over 45% since September and is now resting on declining volume, supported by the 10 and 20 EMAs. A breakout above $137 could signal the start of a new uptrend.
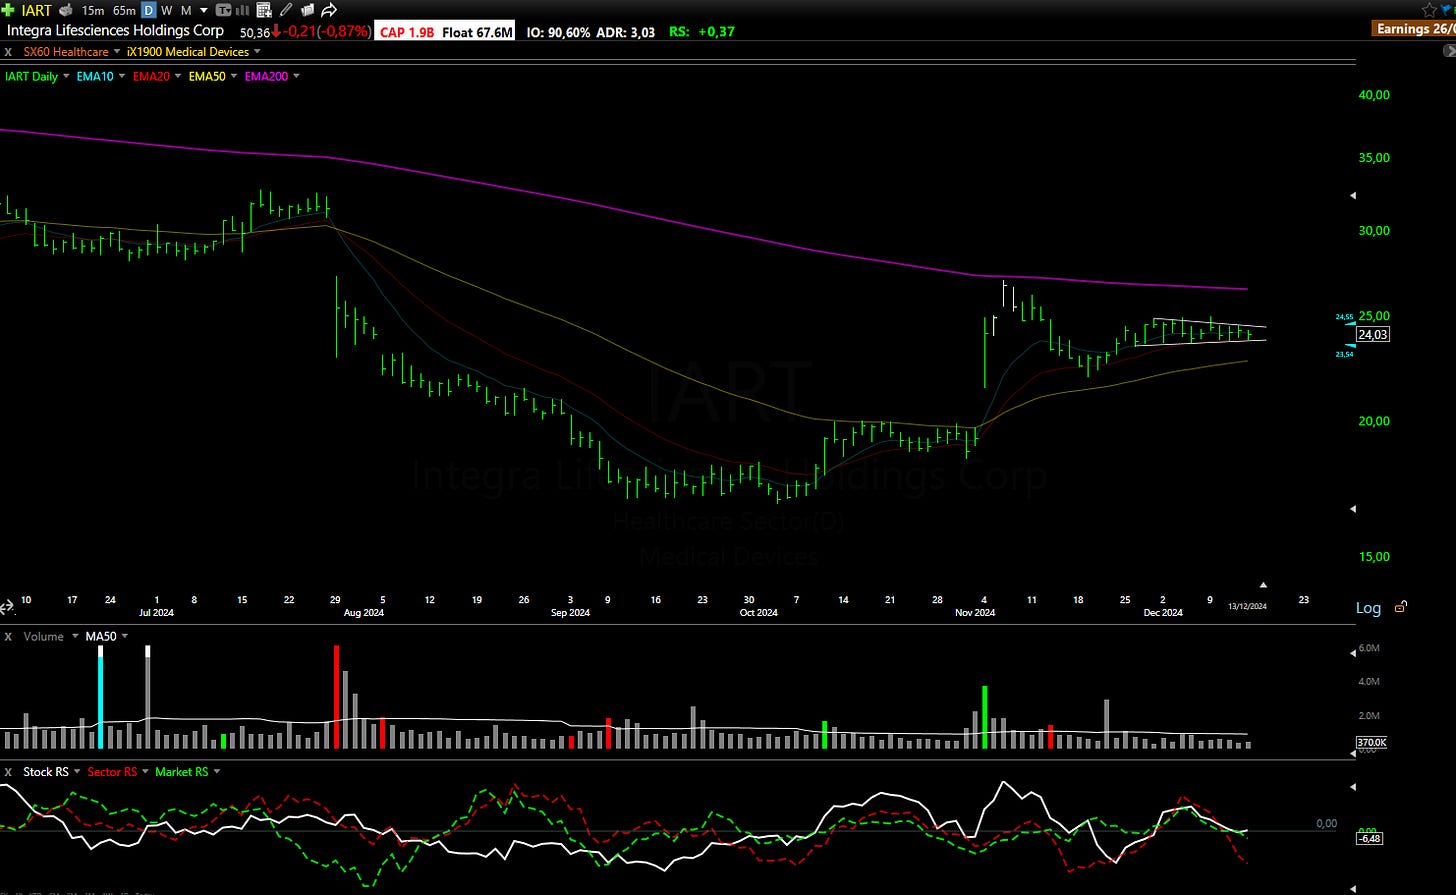
IART: Integra LifeSciences Holdings Corp
What they do: Medical technology company specializing in surgical solutions.
Why watch? 🏥 IART surprised the market with better-than-expected earnings in November. Since then, the stock has pulled back and is consolidating on low volume, supported by the 10 and 20 EMAs. The $25.00 level is a key breakout point.
"The stock market is filled with individuals who know the price of everything, but the value of nothing.”
Philip Fisher

Be the Force Behind Market Mastery - Support Our Community
Your contribution enables us to keep delivering premium market insights at no cost to thousands of investors
Disclaimer: This analysis is for informational purposes only and should not be considered as financial advice. Always conduct your research and consult with a licensed financial advisor before making investment decisions.
Questo pezzo era gratuito. Il prossimo arriva domenica.This piece was free. The next one lands on Sunday.
Dieci nomi con i livelli, la lettura del mercato, la chat con le posizioni in diretta. Con l'abbonamento leggi tutto; senza, ricevi la parte gratuita via email.Ten names with their levels, the market read, the chat with live positions. Subscribers read everything; free readers get the free part by email.